Reports >
Technology And Media
>
3d Display Market Report

3d Display Market Report
First published: 22 September 2024 | Last updated: 31 January 2026 | Report Code: 3d-display
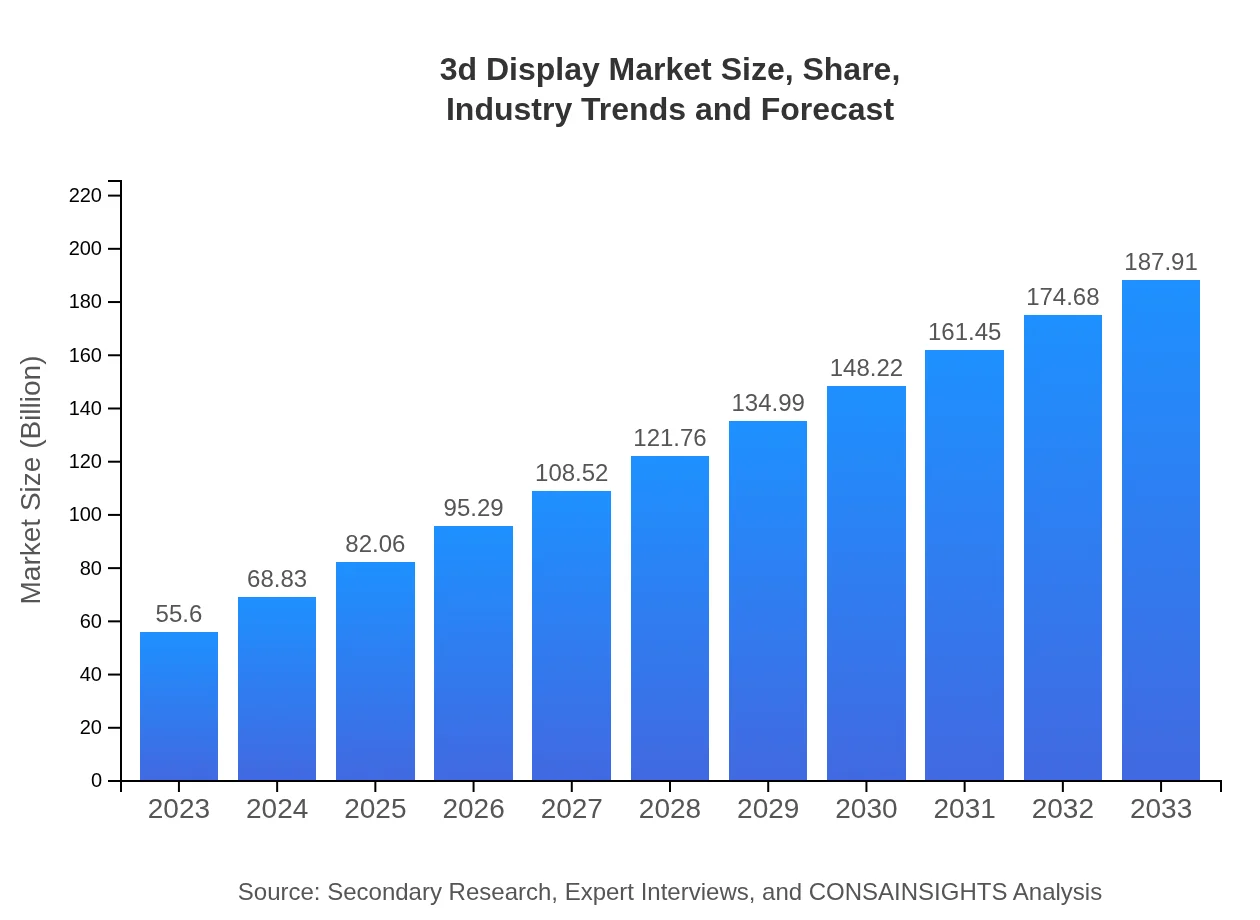
3d Display Market — USD 55.6 billion in 2023, Growing to USD 187.91B by 2033 at 12.4% CAGR
This report provides an in-depth analysis of the 3D display market, covering trends, market size, growth forecasts from 2023 to 2033, and regional insights to help stakeholders understand the evolving landscape of this technology.
| Metric | Value |
|---|---|
| Study Period | 2023 - 2033 |
| 2023 Market Size | $55.60 Billion |
| CAGR (2023-2033) | 12.4% |
| 2033 Market Size | $187.91 Billion |
| Top Companies | LG Display Co., Ltd., Samsung Electronics, Sony Corporation, Panasonic Corporation |
| Published Date | 22 September 2024 |
| Last Modified Date | 31 January 2026 |
3D Display Market Overview
Customize 3d Display Market Report market research report
- ✔ Get in-depth analysis of 3d Display market size, growth, and forecasts.
- ✔ Understand 3d Display's regional dynamics and industry-specific trends.
- ✔ Identify potential applications, end-user demand, and growth segments in 3d Display
What is the Market Size & CAGR of the 3D Display market in 2023?
3D Display Industry Analysis
3D Display Market Segmentation and Scope
Tell us your focus area and get a customized research report.
3D Display Market Analysis Report by Region
Europe 3d Display Market Report:
Europe's market is forecasted to increase from USD 13.82 billion in 2023 to USD 46.70 billion by 2033. The region's focus on enhancing educational and healthcare applications highlights the increasing demand for advanced 3D displays.Asia Pacific 3d Display Market Report:
The Asia Pacific region is anticipated to show remarkable growth, with the market reaching approximately USD 37.28 billion by 2033 from USD 11.03 billion in 2023. Factors contributing to this growth include increased technological integration, thriving gaming industries, and rising consumer electronics demand.North America 3d Display Market Report:
North America holds the largest market share, with a projected growth from USD 21.58 billion in 2023 to USD 72.95 billion by 2033. The region's strong emphasis on entertainment and gaming, combined with rapid technological advancements, drives this growth.South America 3d Display Market Report:
In South America, the 3D display market is expected to grow from USD 1.83 billion in 2023 to USD 6.20 billion by 2033. This growth can be attributed to the increasing adoption of 3D technologies in advertising and retail sectors.Middle East & Africa 3d Display Market Report:
The Middle East and Africa market is poised to grow significantly, from USD 7.33 billion in 2023 to USD 24.79 billion by 2033. Increasing investments in technology and rising consumer electronics penetration are key growth drivers in this region.Tell us your focus area and get a customized research report.
3d Display Market Analysis By Display Type
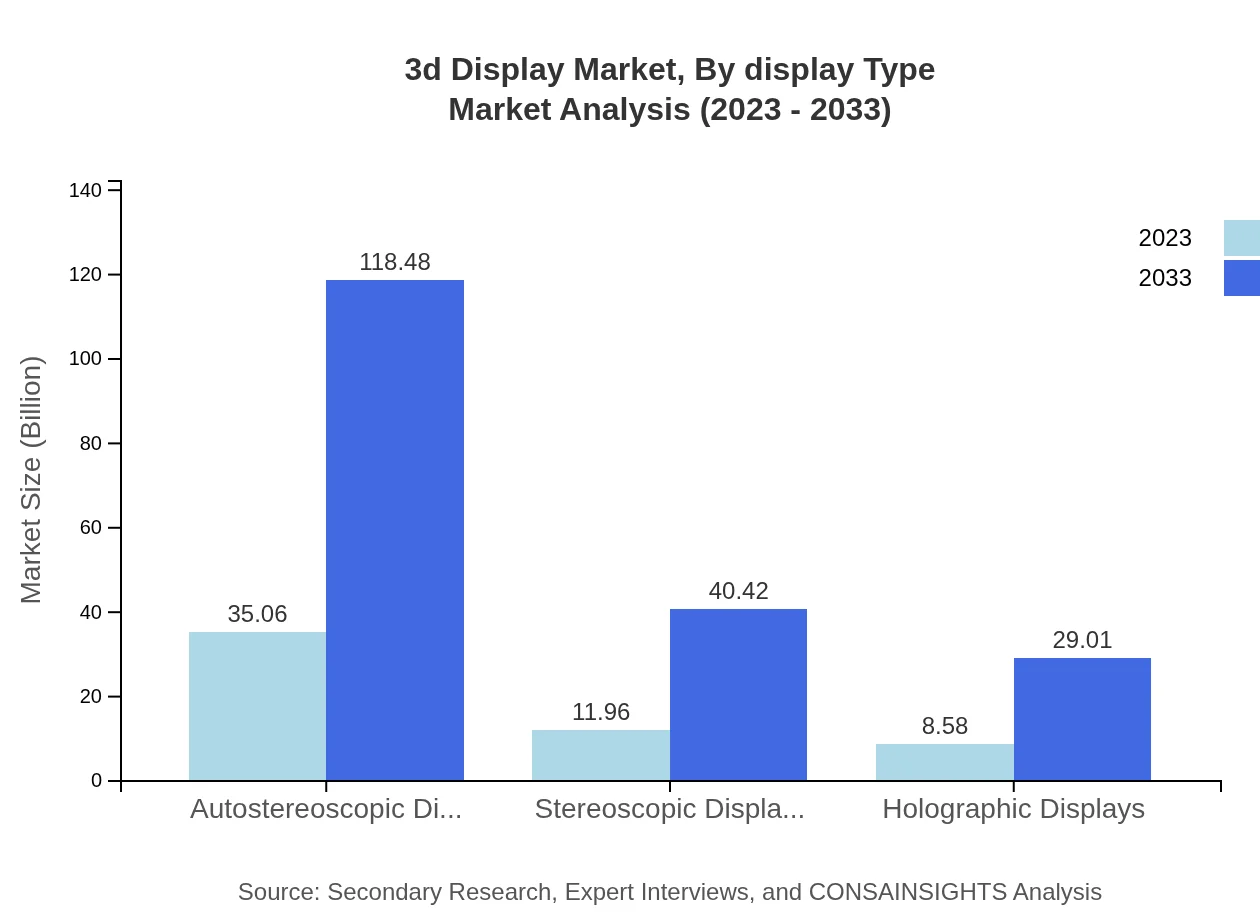
The 3D display market segmented by display type includes autostereoscopic displays, which dominate the market with a share of 63.05% in 2023, while stereoscopic and holographic displays contribute 21.51% and 15.44%, respectively. The demand for autostereoscopic displays in gaming and consumer electronics is a significant driver of this segment.
3d Display Market Analysis By Technology

Technology-wise, the 3D display market primarily revolves around LCD technology, which commands a significant market share of 63.05% in 2023. OLED and microLED technologies are growing segments, capturing shares of 21.51% and 15.44%, respectively, driven by their application in high-end consumer electronics and entertainment solutions.
3d Display Market Analysis By Application
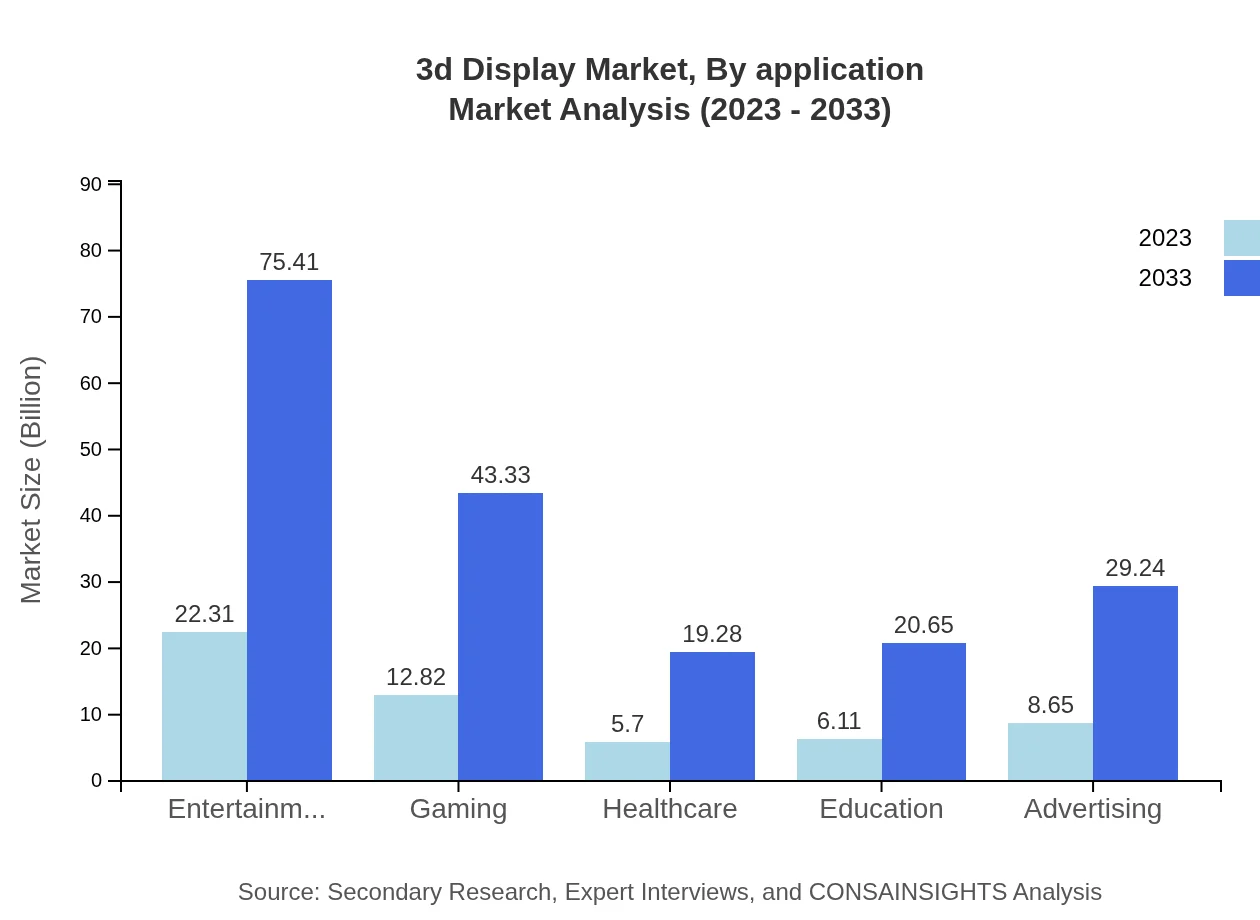
In terms of application, the 3D display market includes substantial segments like consumer electronics, entertainment, healthcare, and education. Consumer electronics lead the market, holding around 40.13%, followed by healthcare and education, increasingly leveraging 3D technologies for enhanced user experiences.
3d Display Market Analysis By End User

The end-user segment showcases diverse applications from industries such as automotive, healthcare, and education. The automotive sector is seeing a rapid adoption of 3D displays for enhanced navigation and user interface, while healthcare applications include medical imaging and surgical simulations.
3d Display Market Analysis By Region
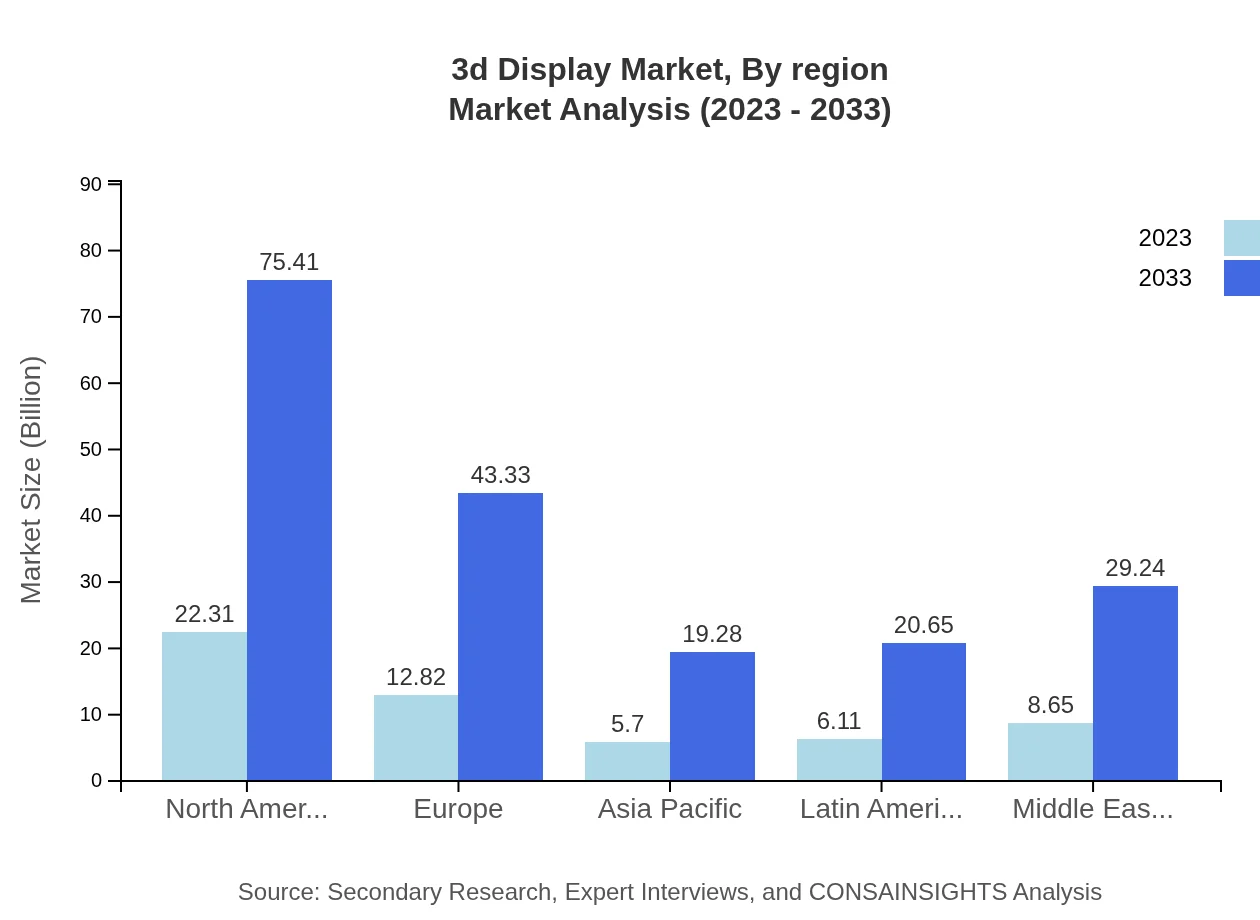
The regional analysis indicates that North America and Europe lead the market, driven by technological innovations and high adoption rates in entertainment and healthcare. Asia Pacific is catching up rapidly, fueled by demographic shifts and the burgeoning consumer electronics market.
3D Display Market Trends and Future Forecast
Tell us your focus area and get a customized research report.
Global Market Leaders and Top Companies in 3D Display Industry
LG Display Co., Ltd.:
A market leader in LCD and OLED technology, LG Display focuses on enhancing consumer and commercial display technology through innovative 3D solutions tailored for various applications.Samsung Electronics:
Known for its cutting-edge technology, Samsung is a significant player in the 3D display sector, providing high-quality displays across entertainment, healthcare, and automotive industries.Sony Corporation:
A pioneer in the entertainment industry, Sony integrates advanced 3D technologies into its products to enhance consumer gaming and video experiences.Panasonic Corporation:
Panasonic specializes in multi-dimensional display technologies and has positioned itself as a key contributor to the advancement of 3D display in various sectors, including advertising and gaming.We're grateful to work with incredible clients.


FAQs
What is the market size of 3D Display?
The 3D display market is projected to reach a market size of $55.6 billion by 2033, growing at a CAGR of 12.4% from its current valuation.
What are the key market players or companies in this 3D display industry?
Key players in the 3D display market include major companies like Samsung, LG Electronics, Sony, and Panasonic, which are leaders in display technology and innovation.
What are the primary factors driving the growth in the 3D display industry?
Growth in the 3D display industry is driven by technological advancements, increased demand in gaming and entertainment, and applications in healthcare and automotive sectors.
Which region is the fastest Growing in the 3D display?
North America is the fastest-growing region in the 3D display market, with projected growth from $21.58 million in 2023 to $72.95 million by 2033.
Does ConsaInsights provide customized market report data for the 3D display industry?
Yes, ConsaInsights offers customized market report data for the 3D display industry, tailored to specific business needs and strategic insights.
What deliverables can I expect from this 3D display market research project?
Deliverables may include detailed market analysis, growth forecasts, competitive landscape, and segment insights, tailored to support strategic decision-making.
What are the market trends of 3D display?
Current trends in the 3D display market include the rise of OLED technology, increased adoption in consumer electronics, and innovations in holographic and autostereoscopic displays.