
Reports >
Life Sciences
>
3d Printed Drugs Market Report

3d Printed Drugs Market Report
First published: 15 October 2024 | Last updated: 28 May 2026 | Report Code: 3d-printed-drugs
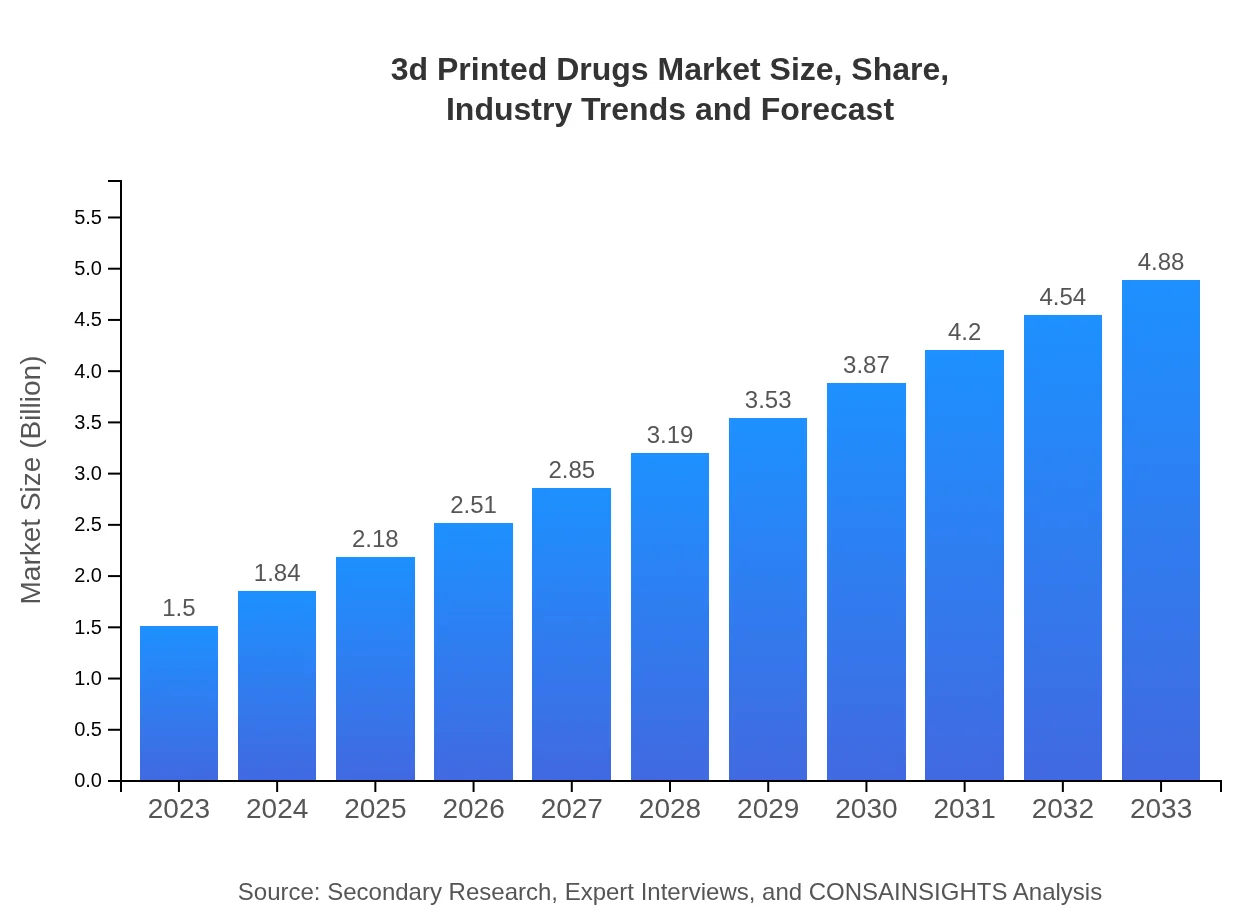
3d Printed Drugs Market — USD 1.5 billion in 2023, Growing to USD 4.88B by 2033 at 12% CAGR
This report provides an in-depth analysis of the 3D Printed Drugs market, forecasting trends and growth from 2023 to 2033. Insights include market size, segmentation, regional analysis, and key players shaping the industry.
Key Takeaways
- Market expands from $1.50 Billion in 2023 to $4.88 Billion in 2033, at a 12% CAGR over 2023 to 2033.
- North America is largest regional market; Middle East and Africa is regional market region based on implied CAGR across 2023 to 2033.
- Middle East and Africa is the regional market region, increasing from $0.15 Billion in 2023 to $0.5 Billion in 2033.
- Europe and Asia Pacific show notable growth: Europe from $0.49 Billion to $1.6 Billion; Asia Pacific from $0.28 Billion to $0.92 Billion.
- Industry participants include Aprecia Pharmaceuticals, Merck & Co., GlaxoSmithKline, Pfizer, and Stratasys.
3d Printed Drugs Market Report — Executive Summary
Regional analysis shows North America as largest market and Middle East and Africa as fastest-growing region by implied CAGR. The 3d Printed Drugs Market Report outlines an emerging pharmaceutical segment expanding from $1.50 Billion in 2023 to $4.88 Billion by 2033, at a 12% CAGR for 2023 to 2033. Growth is propelled by personalized medicine demand, improvements in additive manufacturing, material science advances, and increasing digitization of healthcare production. Regulatory evolution and clinical validation remain important considerations for commercial adoption. Regional patterns vary: North America records the largest market value, while Middle East and Africa posts the highest implied growth rate. Key industry players such as Aprecia Pharmaceuticals, Merck & Co., GlaxoSmithKline, Pfizer, and Stratasys are engaged in development and commercialization efforts. The report segments the market by drug type, technology, end user, application, and regulatory status, offering a layered view of opportunities and adoption pathways for manufacturers, research institutes, and healthcare providers.
Key Growth Drivers
- Rising need for personalized dosing and tailored therapies encourages adoption of additive manufacturing for pharmaceuticals.
- Advancements in 3D printing hardware and material formulations expand feasible drug forms and improve bioavailability.
- Digital workflows and manufacturing automation enable more efficient small-batch production and supply chain flexibility.
- Increasing R&D investment from pharmaceutical firms accelerates development of printable drug formulations.
- Regulatory frameworks adapting to novel manufacturing methods facilitate pathway definitions for approval and commercialization.
| Metric | Value |
|---|---|
| Study Period | 2023 - 2033 |
| 2023 Market Size | $1.50 Billion |
| CAGR (2023-2033) | 12% |
| 2033 Market Size | $4.88 Billion |
| Top Companies | Aprecia Pharmaceuticals, Merck & Co., GlaxoSmithKline, Pfizer , Stratasys |
| Published Date | 15 October 2024 |
| Last Modified Date | 28 May 2026 |
3D Printed Drugs Market Overview
Customize 3d Printed Drugs Market Report market research report
- ✔ Get in-depth analysis of 3d Printed Drugs market size, growth, and forecasts.
- ✔ Understand 3d Printed Drugs's regional dynamics and industry-specific trends.
- ✔ Identify potential applications, end-user demand, and growth segments in 3d Printed Drugs
What is the Market Size & CAGR of 3d Printed Drugs Market Report market in 2023?
3D Printed Drugs Industry Analysis
3D Printed Drugs Market Segmentation and Scope
Tell us your focus area and get a customized research report.
3d Printed Drugs Market Report Market Analysis Report by Region
Europe 3d Printed Drugs Market Report:
Europe grows from $0.49 Billion in 2023 to $1.6 Billion in 2033. Market progression is supported by active research collaborations, evolving regulatory guidance, and investments in additive manufacturing for tailored therapies.Asia Pacific 3d Printed Drugs Market Report:
Asia Pacific grows from $0.28 Billion in 2023 to $0.92 Billion in 2033. Expansion is underpinned by increasing pharmaceutical R&D capacity, adoption of digital production workflows, and growing interest in personalized medicine across markets.North America 3d Printed Drugs Market Report:
North America is largest regional market, rising from $0.56 Billion in 2023 to $1.81 Billion in 2033. Regional momentum reflects strong pharmaceutical R&D activity, established manufacturing infrastructure, and early adoption of novel production technologies.South America 3d Printed Drugs Market Report:
Latin America grows from $0.02 Billion in 2023 to $0.05 Billion in 2033. Growth drivers include expanding clinical research activities and gradual uptake of advanced manufacturing techniques in niche therapeutic segments.Middle East & Africa 3d Printed Drugs Market Report:
Middle East and Africa is fastest-growing region by implied CAGR, increasing from $0.15 Billion in 2023 to $0.5 Billion in 2033. Regional acceleration is driven by targeted investments in healthcare infrastructure, interest in personalized treatment approaches, and adoption of new manufacturing technologies at select centers.Tell us your focus area and get a customized research report.
Research Methodology
3d Printed Drugs Market Analysis By Drug Type
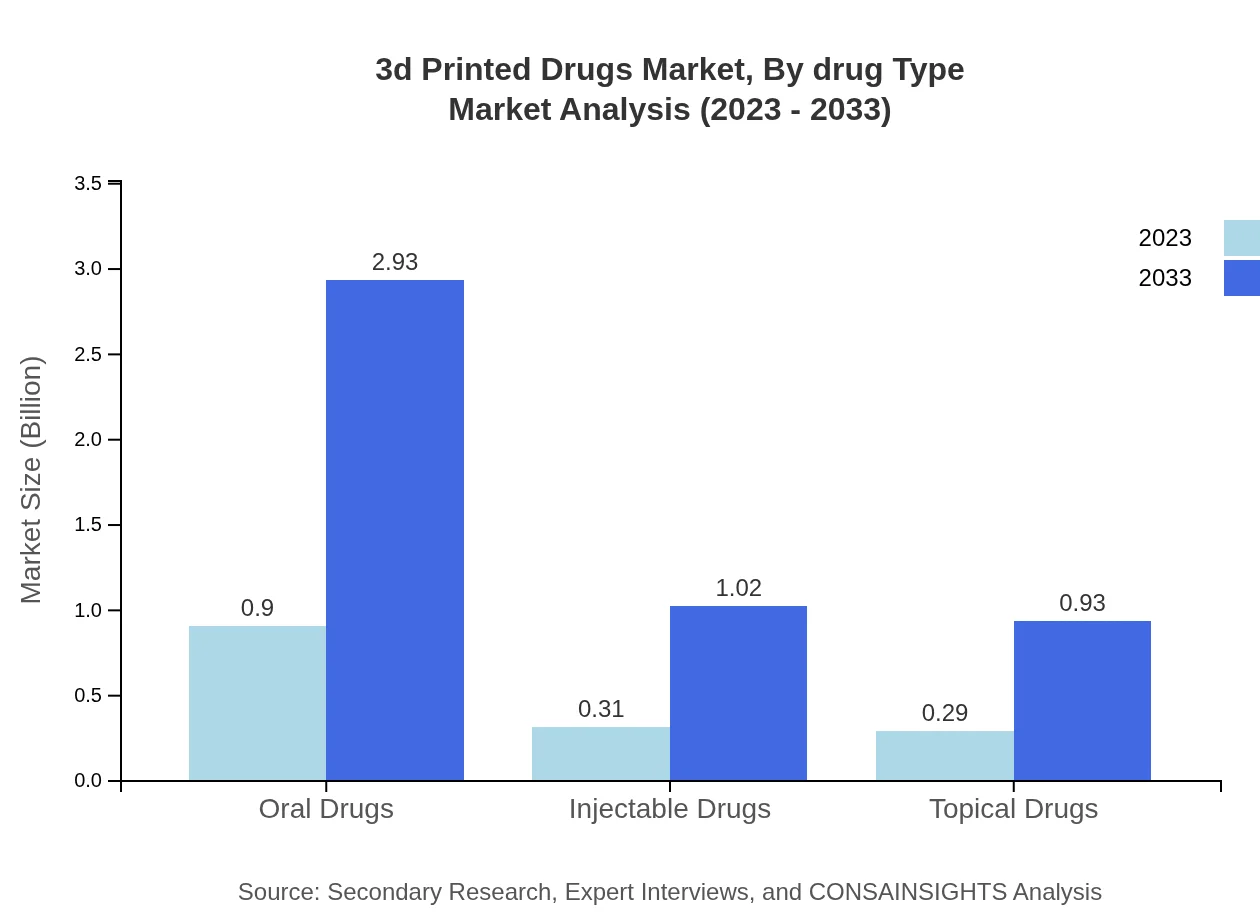
The drug type segmentation reveals significant insights. Oral drugs dominated in 2023 with a market size of $0.90 billion, projected to grow to $2.93 billion by 2033, holding a market share of 60.13%. Injectable drugs follow with a size of $0.31 billion, expected to progress to $1.02 billion (20.84% share), while topical drugs comprise $0.29 billion, projected to grow to $0.93 billion (19.03% share). This distribution highlights the demand for oral formulations for patient convenience.
3d Printed Drugs Market Analysis By Technology
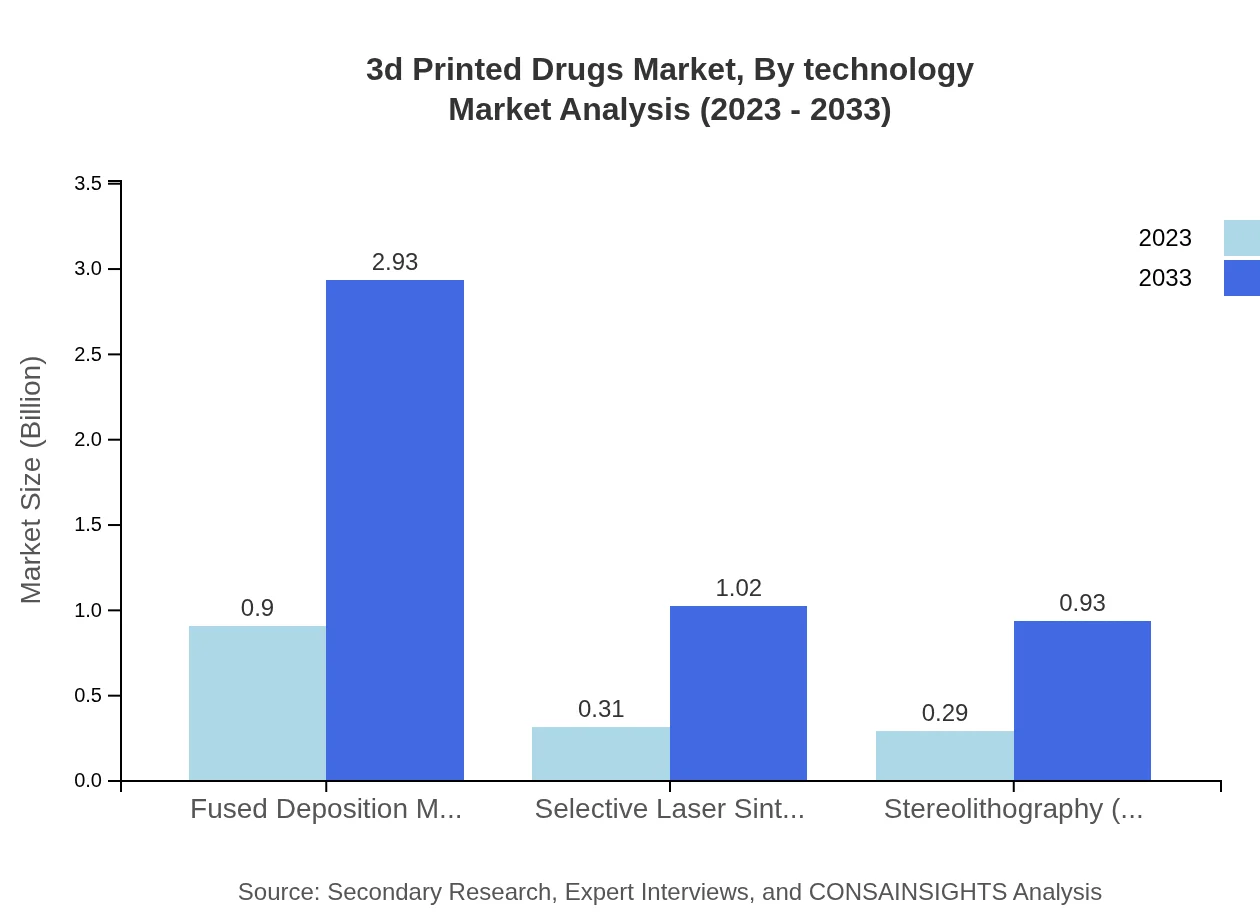
Fused Deposition Modeling (FDM) is the leading technology segment with a market size of $0.90 billion in 2023, growing to $2.93 billion by 2033 (60.13% market share). Selective Laser Sintering (SLS) and Stereolithography (SLA) are also significant, valued at $0.31 billion and $0.29 billion respectively in 2023, expected to increase to $1.02 billion and $0.93 billion by 2033. These technologies are pivotal for creating complex geometries in drug formulation.
3d Printed Drugs Market Analysis By Application
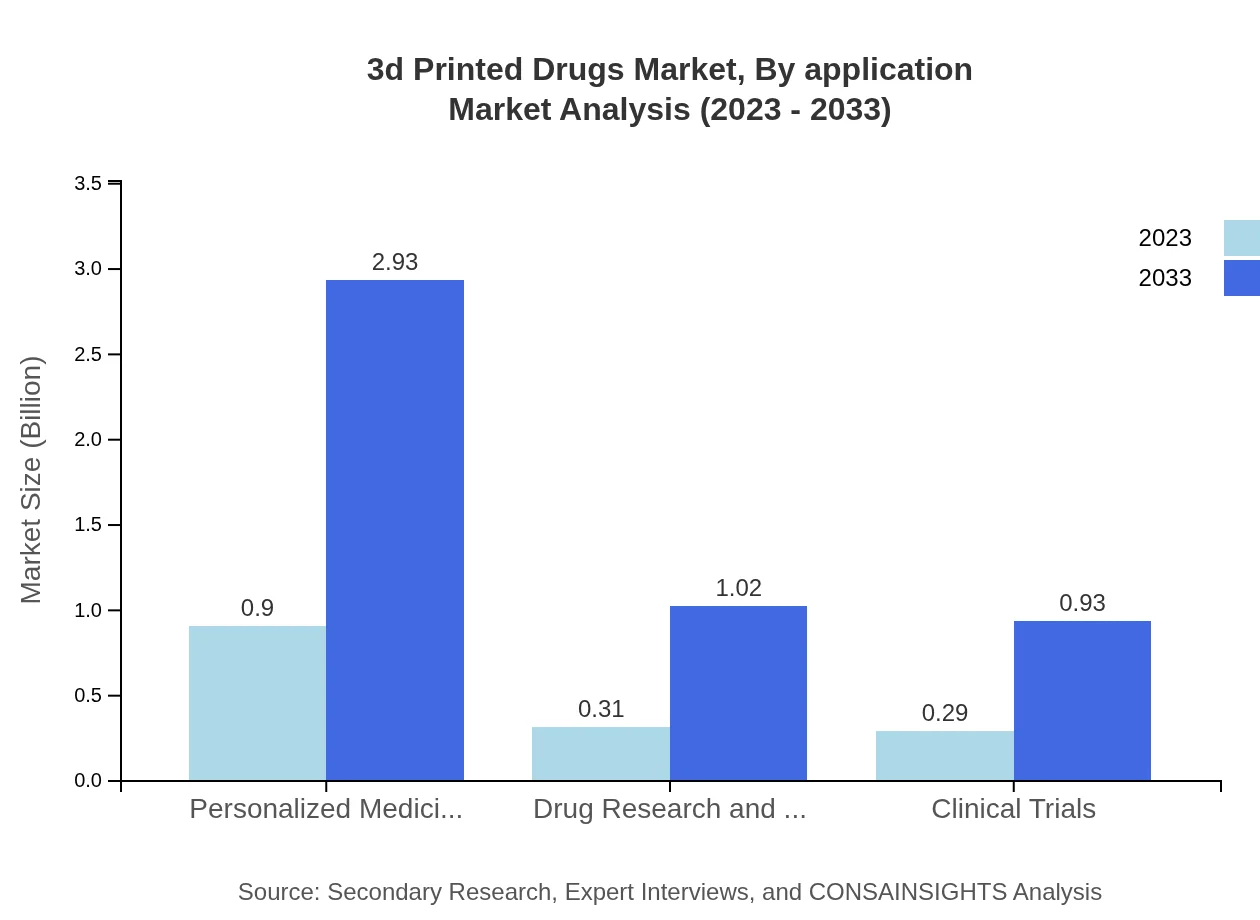
In the application segment, the key focus areas include drug research and development, clinical trials, and personalized medicine. Drug research and development represented a market size of $0.31 billion in 2023, projected to grow to $1.02 billion by 2033 (20.84% market share). Clinical trials hold a similar position with a size of $0.29 billion and a projected growth to $0.93 billion (19.03% market share), showing the increasing trend towards 3D printing solutions for trial processes.
3d Printed Drugs Market Analysis By End User
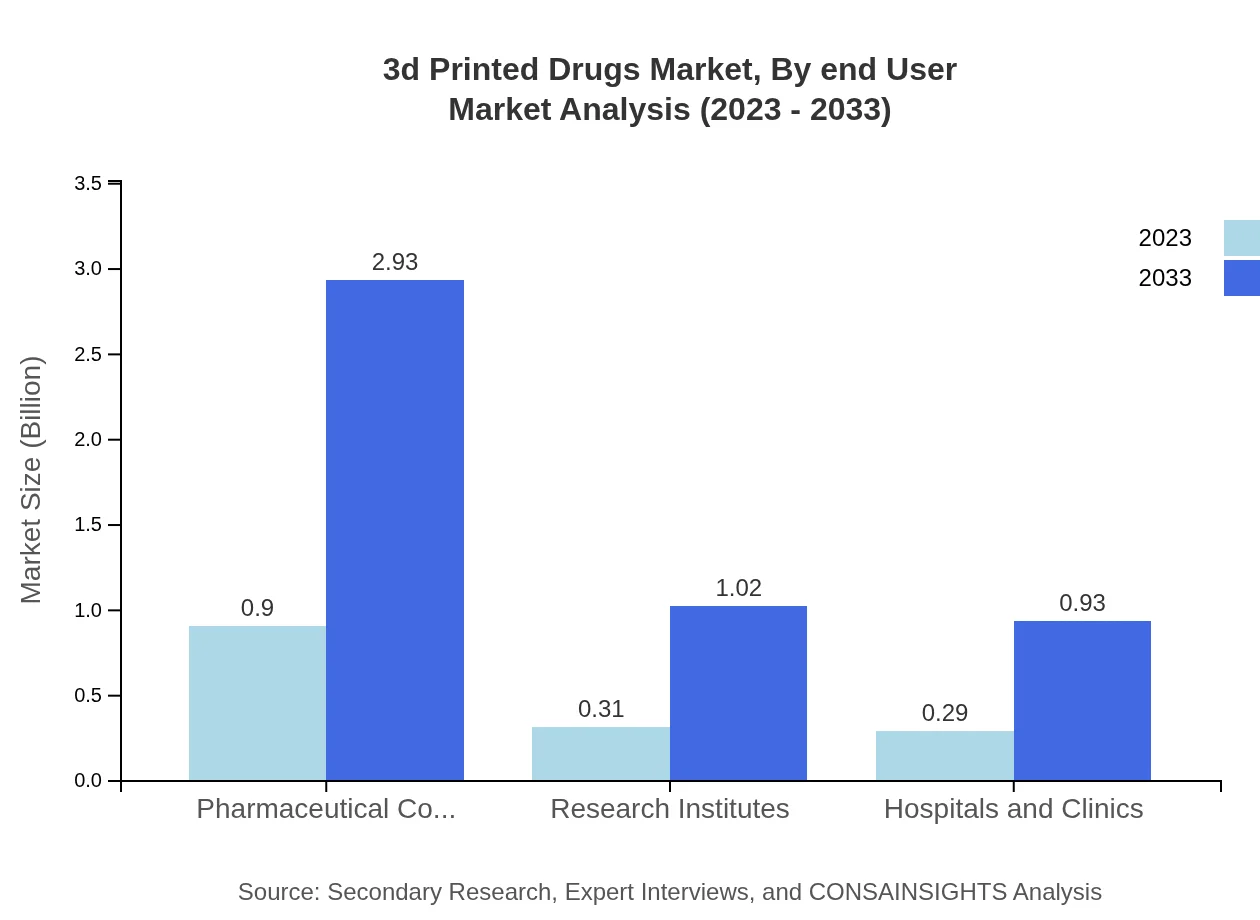
The end-user segmentation identifies pharmaceutical companies as the largest consumers, valued at $0.90 billion in 2023 and expected to increase to $2.93 billion by 2033 (60.13% market share). Research institutes and hospitals/clinics follow, with $0.31 billion and $0.29 billion respectively in 2023, showing the trend towards integrating 3D printing technologies in various healthcare applications.
3d Printed Drugs Market Analysis By Regulatory Framework
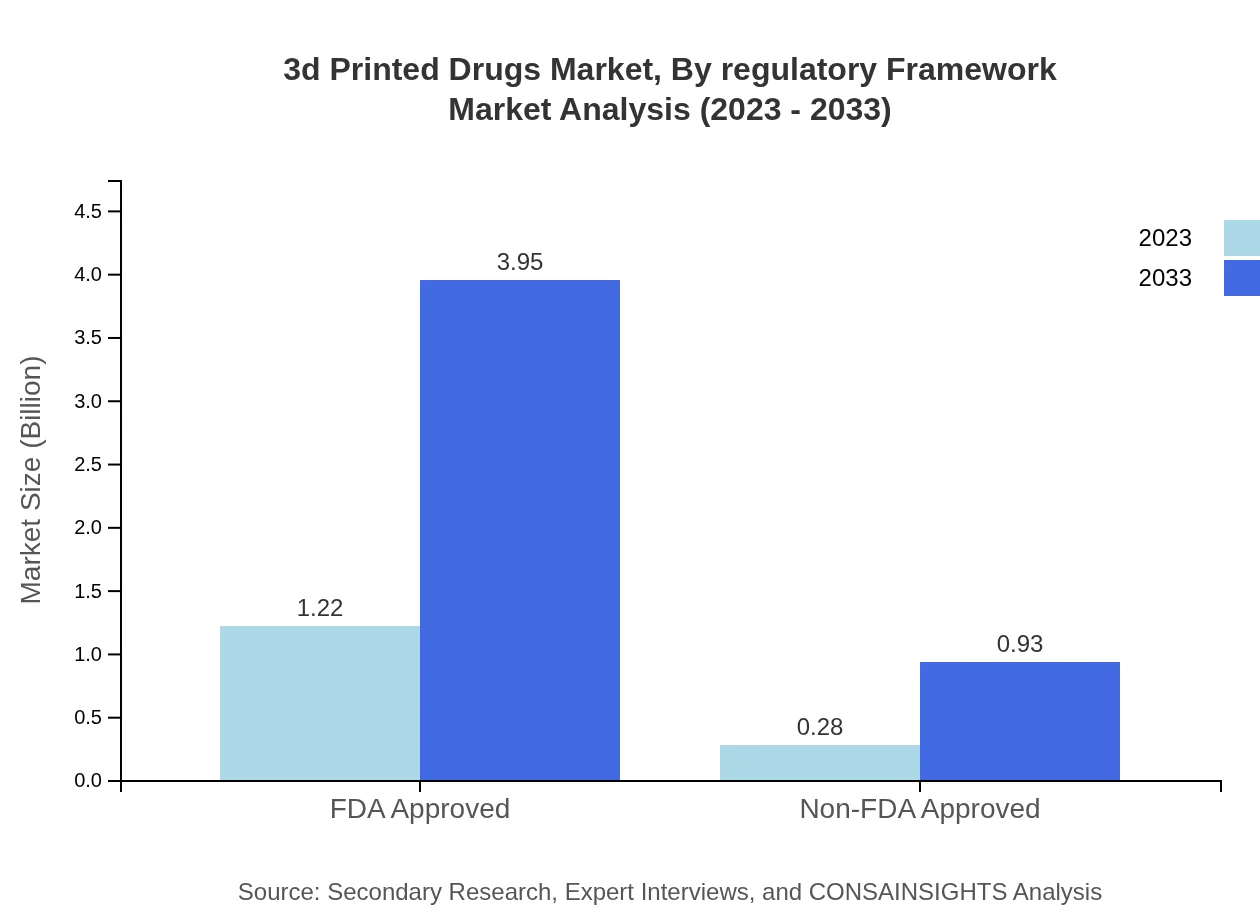
The regulatory framework plays a critical role in shaping the market, with a high emphasis on FDA-approved products. In 2023, FDA-approved drugs held a $1.22 billion market size, anticipated to reach $3.95 billion by 2033 (81.04% market share). Non-FDA approved products, valued at $0.28 billion, are projected to rise to $0.93 billion (18.96% share), reflecting the industry's shift towards ensuring compliance with health regulations.
3D Printed Drugs Market Trends and Future Forecast
Tell us your focus area and get a customized research report.
Global Market Leaders and Top Companies in 3D Printed Drugs Industry
Aprecia Pharmaceuticals:
Pioneered the first FDA-approved 3D printed drug, Spritam, which provides an innovative solution for epilepsy patients through precise dosing.Merck & Co.:
Investing heavily in 3D printing technology to enhance drug delivery systems and personalized medicine applications.GlaxoSmithKline:
Active in research and development for 3D printed formulations, focusing on improving patient adherence and treatment outcomes.Pfizer :
Exploring 3D printing as a means to manufacture drug combinations that meet specific patient needs effectively.Stratasys:
Leads in providing 3D printing solutions that support the pharmaceutical industry in developing innovative medication forms.We're grateful to work with incredible clients.








FAQs
What is the market size of the 3d Printed Drugs Market Report in 2023?
The market size in 2023 is $1.50 Billion, as stated in the report's baseline year figure and used for subsequent forecasting.
How big will the market be in 2033?
The market is projected to reach $4.88 Billion by 2033 according to the provided forecast values.
What is CAGR of the market for 2023 to 2033?
The report specifies a compound annual growth rate of 12% for the forecast period 2023 to 2033.
Which region is the fastest Growing in the 3d Printed Drugs Market Report market?
Middle East and Africa is the fastest-growing region, projected to expand from $0.15 Billion in 2023 to $0.5 Billion in 2033, reflecting an implied 12.79% CAGR over the forecast period.
Which region is fastest Growing?
Middle East and Africa is the regional market region, rising from $0.15 Billion in 2023 to $0.5 Billion in 2033 at an implied 12.79% CAGR.
Who are the leading companies mentioned in the report?
Top companies listed include Aprecia Pharmaceuticals, Merck & Co., GlaxoSmithKline, Pfizer, and Stratasys.
What are common applications for 3D Printed drugs?
Applications highlighted include personalized medicine, drug research and development, and support for clinical trials.
How is regulatory status categorized in the segmentation?
The report segments regulatory frameworks into FDA Approved and Non-FDA Approved categories to reflect differing approval pathways.