
Accounts Payable Automation Market Report
Published Date: 31 January 2026 | Report Code: accounts-payable-automation
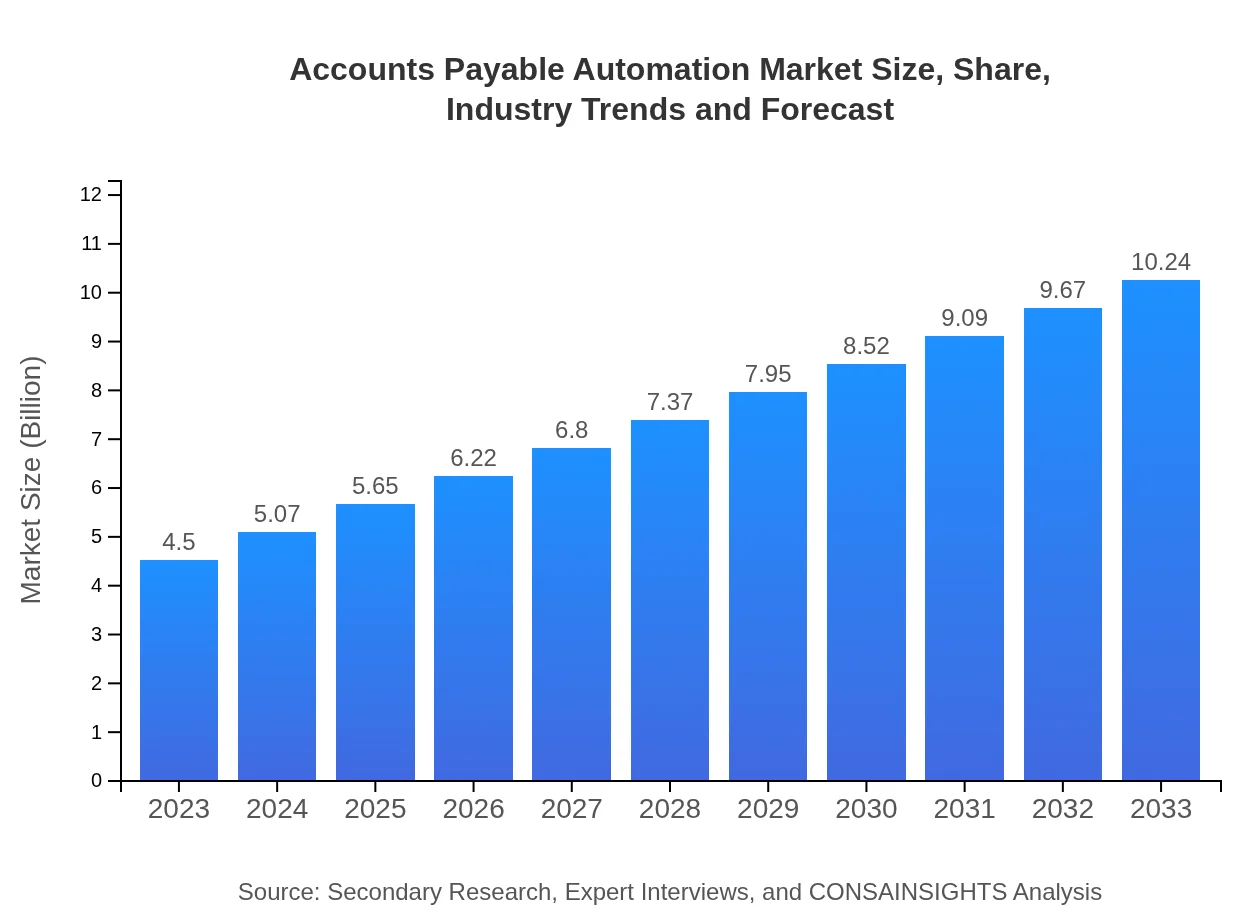
Accounts Payable Automation Market Size, Share, Industry Trends and Forecast to 2033
This report provides an in-depth analysis of the Accounts Payable Automation market from 2023 to 2033, covering market size, growth trends, segmentation, technology advancements, and regional insights.
| Metric | Value |
|---|---|
| Study Period | 2023 - 2033 |
| 2023 Market Size | $4.50 Billion |
| CAGR (2023-2033) | 8.3% |
| 2033 Market Size | $10.24 Billion |
| Top Companies | SAP, Coupa Software, Oracle, Bill.com, Basware |
| Last Modified Date | 31 January 2026 |
Accounts Payable Automation Market Overview
Customize Accounts Payable Automation Market Report market research report
- ✔ Get in-depth analysis of Accounts Payable Automation market size, growth, and forecasts.
- ✔ Understand Accounts Payable Automation's regional dynamics and industry-specific trends.
- ✔ Identify potential applications, end-user demand, and growth segments in Accounts Payable Automation
What is the Market Size & CAGR of Accounts Payable Automation market in 2023?
Accounts Payable Automation Industry Analysis
Accounts Payable Automation Market Segmentation and Scope
Tell us your focus area and get a customized research report.
Accounts Payable Automation Market Analysis Report by Region
Europe Accounts Payable Automation Market Report:
Accounting for a significant share, the European market is forecasted to rise from $1.36 billion in 2023 to $3.09 billion by 2033. The acceleration in the adoption of digital solutions and ongoing initiatives toward paperless environments greatly contribute to this growth.Asia Pacific Accounts Payable Automation Market Report:
The Asia Pacific region is expected to witness substantial growth in the Accounts Payable Automation market, transitioning from a valuation of $0.79 billion in 2023 to $1.80 billion by 2033. This growth is driven by increasing IT spending, a growing emphasis on automation technologies, and the expanding digital economy.North America Accounts Payable Automation Market Report:
North America dominates the Accounts Payable Automation market, projected to grow from $1.68 billion in 2023 to $3.83 billion by 2033. This growth is attributed to the high concentration of technology providers, increased awareness of automation benefits, and a supportive regulatory environment.South America Accounts Payable Automation Market Report:
In South America, the Accounts Payable Automation market is projected to grow from $0.32 billion in 2023 to $0.72 billion by 2033. During this period, businesses are increasingly adopting automation solutions to streamline operations and reduce costs, propelling market expansion.Middle East & Africa Accounts Payable Automation Market Report:
The Middle East and Africa's market is projected to expand from $0.36 billion in 2023 to $0.81 billion by 2033. Economic diversification efforts and increased investments in technology solutions are driving demand for automation in financial operations.Tell us your focus area and get a customized research report.
Accounts Payable Automation Market Analysis By Product

In 2023, the software solutions segment dominates the market with a size of $3.04 billion and remains stable with a projected size of $6.93 billion by 2033. Hardware solutions follow with a projected growth from $1.12 billion to $2.55 billion, and professional services are expected to increase from $0.34 billion to $0.77 billion.
Accounts Payable Automation Market Analysis By Application
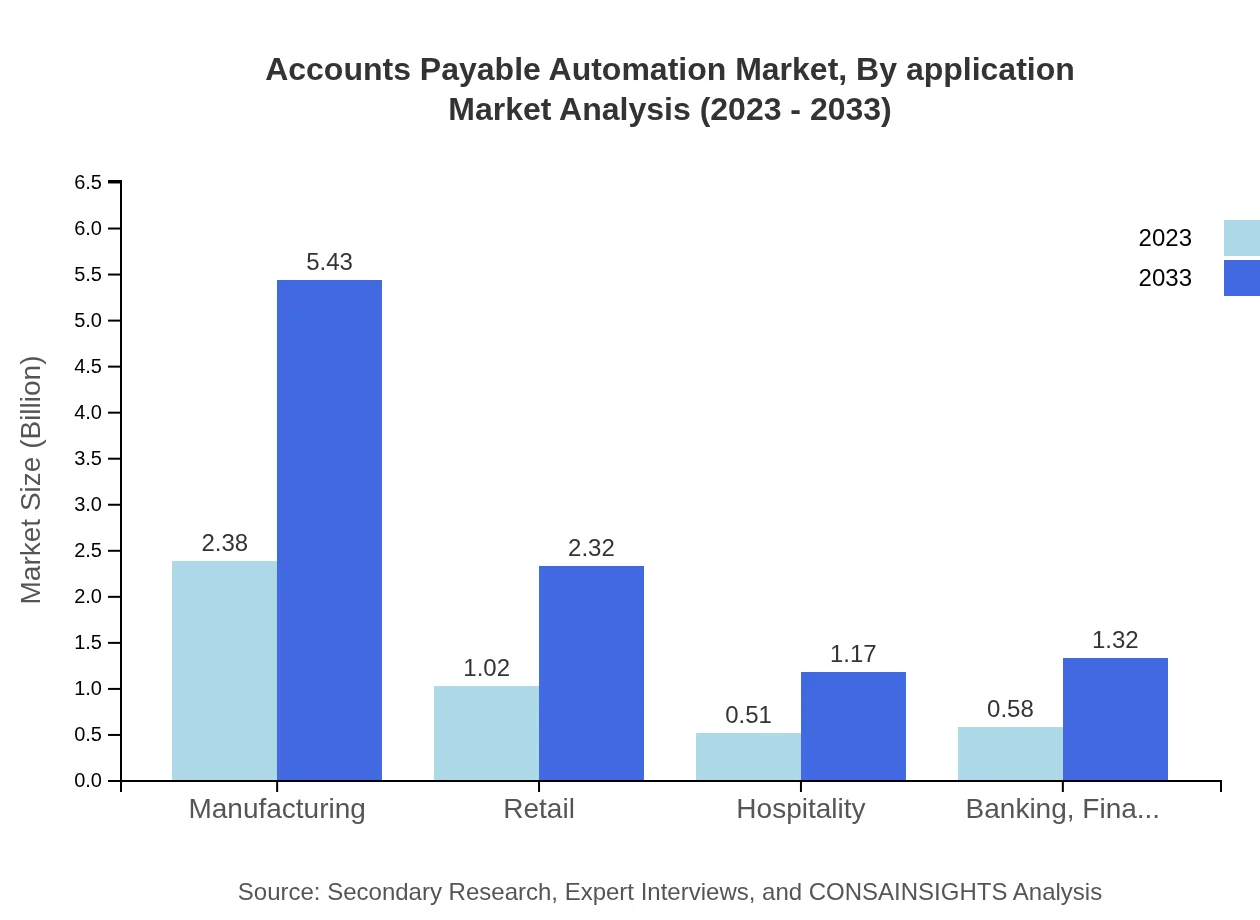
The application segment is predominantly focused on invoice management, which streamlines the delivery of invoices, reduces processing time, and enhances compliance. This sector is projected to grow consistently due to increased market demand for efficient invoice processing.
Accounts Payable Automation Market Analysis By Deployment Mode
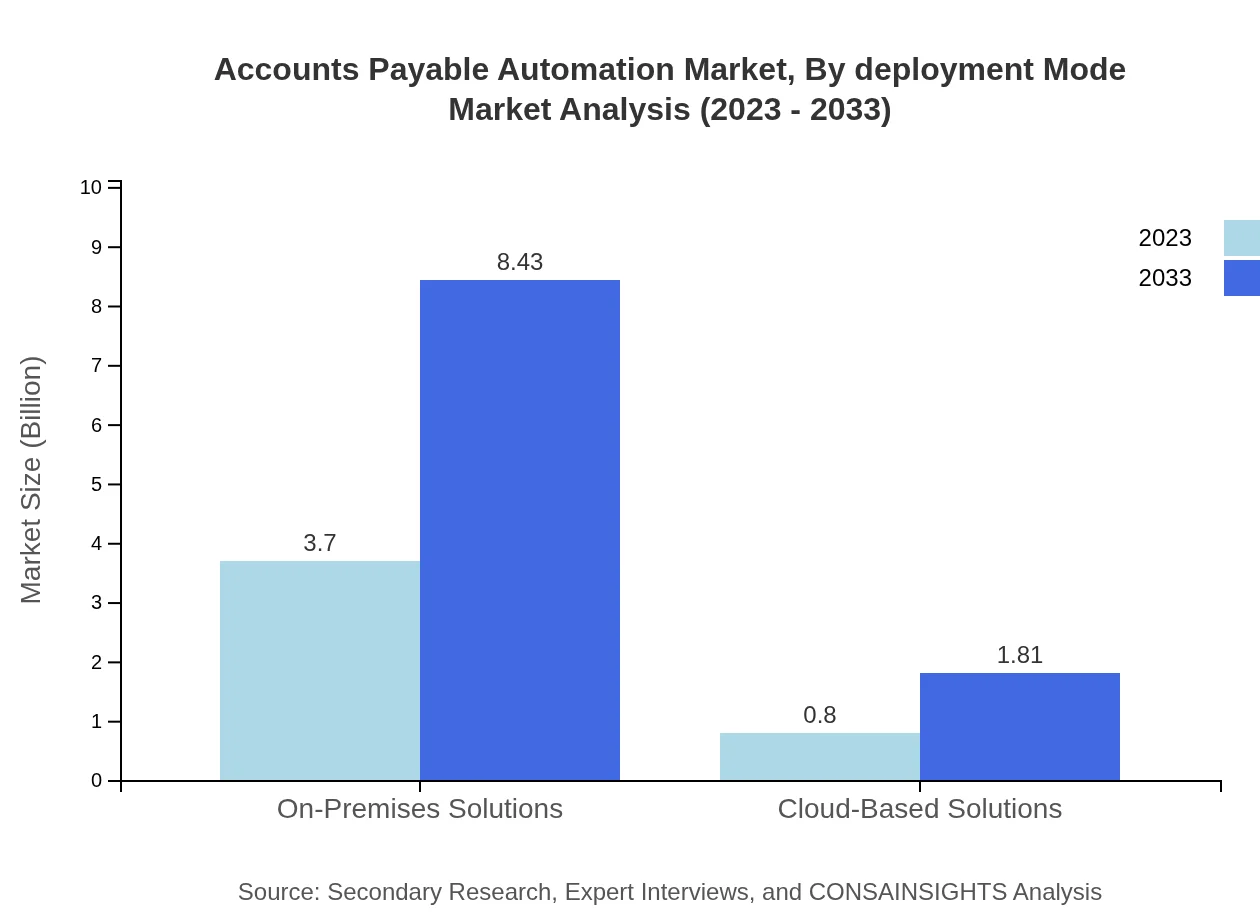
On-premises solutions lead the deployment mode segment, expected to grow from $3.70 billion in 2023 to $8.43 billion by 2033. Cloud-based solutions, although smaller, are also on the rise, moving from $0.80 billion to $1.81 billion, driven by the flexibility and scalability they offer.
Accounts Payable Automation Market Analysis By Company Size

Small businesses are major contributors to market share with a size of $3.04 billion in 2023, stabilizing at $6.93 billion by 2033. Medium-sized enterprises range from $1.12 billion to $2.55 billion, while large enterprises are anticipated to grow modestly from $0.34 billion to $0.77 billion.
Accounts Payable Automation Market Analysis By Industry
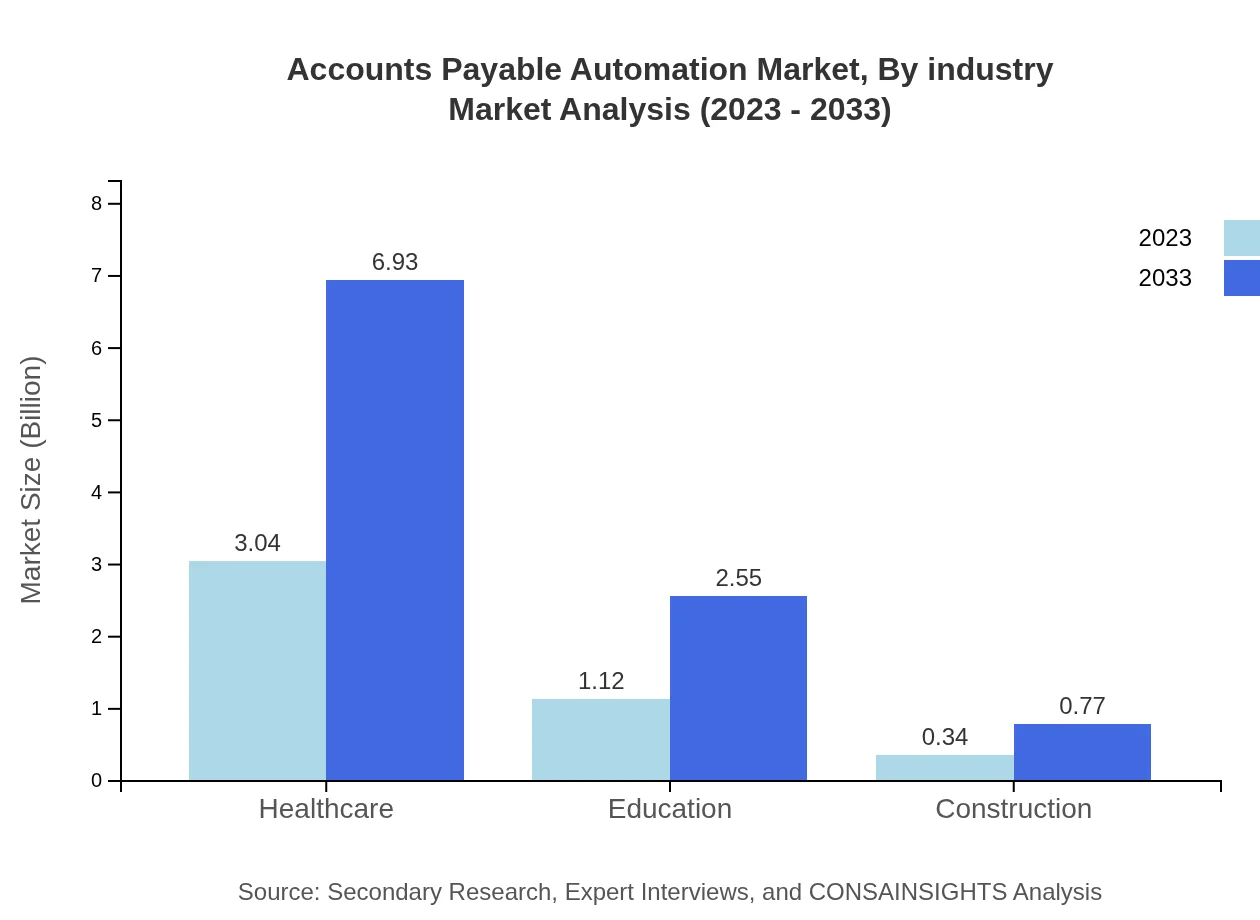
The manufacturing sector takes a major share of the market with a size of $2.38 billion in 2023 while growing to approximately $5.43 billion by 2033. Healthcare and education follow closely, reflecting strong investment in automation technologies across various sectors.
Accounts Payable Automation Market Trends and Future Forecast
Tell us your focus area and get a customized research report.
Global Market Leaders and Top Companies in Accounts Payable Automation Industry
SAP:
SAP is a renowned leader in enterprise resource planning (ERP) solutions that assist companies with their financial management, including accounts payable automation.Coupa Software:
Coupa Software specializes in business spend management and provides comprehensive accounts payable solutions enabling organizations to optimize all aspects of procurement and payments.Oracle:
Oracle offers a range of cloud-based solutions to streamline financial operations, including advanced accounts payable functionalities integrated within its broader financial suite.Bill.com:
Bill.com focuses on small to medium-sized businesses by providing cloud-based accounts payable solutions that improve payment workflows and digital invoicing capabilities.Basware:
Basware delivers innovative solutions in the field of accounts payable automation, helping organizations reduce processing times and enhance financial visibility.We're grateful to work with incredible clients.


FAQs
What is the market size of accounts Payable Automation?
The accounts payable automation market is valued at approximately $4.5 billion in 2023 and is expected to grow at a CAGR of 8.3%. By 2033, the market is projected to expand significantly, reflecting increased adoption of automation technologies.
What are the key market players or companies in this accounts Payable Automation industry?
Key players in the accounts payable automation industry include renowned software companies, technology firms, and enterprise service providers who offer diverse solutions, ranging from software systems to complete automation services for financial processes.
What are the primary factors driving the growth in the accounts Payable Automation industry?
Growth in the accounts payable automation industry is driven by factors such as the increasing need for operational efficiency, cost reduction through automation, and the growing demand for accuracy and faster transaction processing in financial operations.
Which region is the fastest Growing in the accounts Payable Automation?
Asia Pacific is the fastest-growing region in the accounts payable automation market, anticipated to rise from $0.79 billion in 2023 to $1.80 billion by 2033, demonstrating a robust demand for automation solutions across various sectors.
Does ConsaInsights provide customized market report data for the accounts Payable Automation industry?
Yes, Consainsights offers customized market report data tailored to the specific needs of clients in the accounts payable automation industry, ensuring they receive relevant insights and analytics for informed decision-making.
What deliverables can I expect from this accounts Payable Automation market research project?
Deliverables from the market research project include a detailed report on market trends, segment analysis, competitive landscape, forecasts, and actionable insights into growth opportunities in the accounts payable automation sector.
What are the market trends of accounts Payable Automation?
Current trends in the accounts payable automation market show a shift towards cloud-based solutions, growing demand for advanced analytics, and increasing integration of AI technologies, enhancing the efficiency and scalability of financial processes.