
Reports >
Life Sciences
>
Advanced Visualization Market Report

Advanced Visualization Market Report
First published: 21 October 2024 | Last updated: 25 May 2026 | Report Code: advanced-visualization
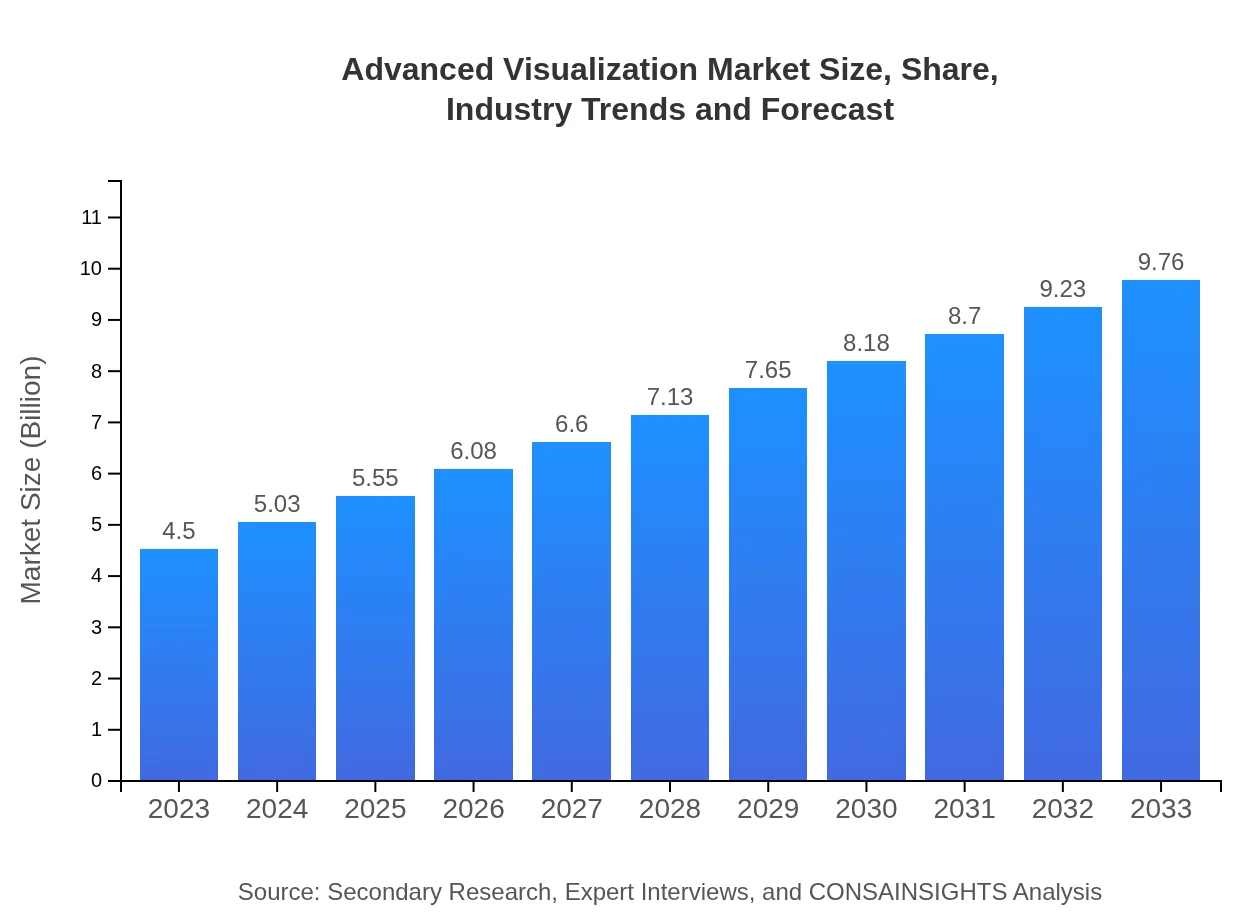
Advanced Visualization Market — USD 4.5 billion in 2023, Growing to USD 9.76B by 2033 at 7.8% CAGR
This report provides a comprehensive analysis of the Advanced Visualization market, covering key insights from 2023 to 2033, including market trends, regional analyses, and segment performance projections.
Key Takeaways
- Global market expands from $4.50 Billion in 2023 to $9.76 Billion by 2033 at a 7.8% CAGR.
- North America is largest regional market, while no single fastest-growing region is stated because regional CAGR differences remain within 0.15 percentage points.
- Europe increases from $1.32 Billion in 2023 to $2.87 Billion in 2033, reflecting steady demand across sectors.
- Asia Pacific grows from $0.90 Billion to $1.95 Billion, driven by institutional and enterprise investment in visualization technologies.
- Services, software, hardware, and immersive technologies such as AR/VR are central to deployment strategies and buyer decisions.
Advanced Visualization Market Report — Executive Summary
North America remains largest market by forecast-period value, while no single fastest-growing region is stated because top regional growth rates are separated by less than 0.15 percentage points. This report maps the Advanced Visualization market’s expansion from $4.50 Billion in 2023 to $9.76 Billion by 2033, supported by a 7.8% CAGR for 2023 to 2033. Demand is propelled by digital transformation initiatives, adoption of immersive interfaces, and advanced analytics across life-sciences and other sectors. Vendors such as Siemens Healthineers, Thermo Fisher Scientific, Autodesk, Tableau Software, and NVIDIA play active roles in product evolution and go-to-market approaches. The analysis covers product categories—software, hardware, and services—alongside deployment models like on-premises and cloud, and technologies including 2D, 3D, augmented reality, and virtual reality. Regional breakdowns document North America’s leading position and notable growth patterns in Europe, Asia Pacific, Latin America, and the Middle East and Africa. Chapters include market sizing, trend evaluation, segmentation by industry and user type, and a competitive overview to inform procurement, investment, and strategic planning.
Key Growth Drivers
- Rising digital transformation initiatives that increase demand for interactive visualization and analytics tools across enterprises.
- Integration of machine learning and advanced image processing that enhances capability to handle complex datasets.
- Growing use of AR and VR for training, simulation, and immersive experiences across healthcare, education, and enterprise training.
- Increased investment in cloud deployment options enabling scalable access to visualization software and services.
- Expansion of service offerings and vendor partnerships facilitating tailored implementations for industry-specific workflows.
| Metric | Value |
|---|---|
| Study Period | 2023 - 2033 |
| 2023 Market Size | $4.50 Billion |
| CAGR (2023-2033) | 7.8% |
| 2033 Market Size | $9.76 Billion |
| Top Companies | Siemens Healthineers, Thermo Fisher Scientific, Autodesk , Tableau Software, NVIDIA |
| Published Date | 21 October 2024 |
| Last Modified Date | 25 May 2026 |
Advanced Visualization Market Overview
Customize Advanced Visualization Market Report market research report
- ✔ Get in-depth analysis of Advanced Visualization market size, growth, and forecasts.
- ✔ Understand Advanced Visualization's regional dynamics and industry-specific trends.
- ✔ Identify potential applications, end-user demand, and growth segments in Advanced Visualization
What is the Market Size & CAGR of Advanced Visualization Market Report market in 2023?
Advanced Visualization Industry Analysis
Advanced Visualization Market Segmentation and Scope
Tell us your focus area and get a customized research report.
Advanced Visualization Market Report Market Analysis Report by Region
Europe Advanced Visualization Market Report:
Europe grows from $1.32 Billion in 2023 to $2.87 Billion in 2033. Demand in this region is influenced by digital initiatives in healthcare and education, and by enterprises adopting complex visualization for analytics and operational use.Asia Pacific Advanced Visualization Market Report:
Asia Pacific grows from $0.9 Billion in 2023 to $1.95 Billion in 2033. Growth is spurred by growing institutional investment, increasing adoption of immersive learning tools, and rising enterprise interest in advanced visualization capabilities.North America Advanced Visualization Market Report:
North America is largest regional market, rising from $1.45 Billion in 2023 to $3.14 Billion in 2033. Market expansion here is supported by strong enterprise investment, significant healthcare technology adoption, and vendor activity from established suppliers.South America Advanced Visualization Market Report:
Latin America grows from $0.45 Billion in 2023 to $0.98 Billion in 2033. Regional uptake is supported by expanding use cases in industry digitization, training, and analytics, along with growing vendor presence.Middle East & Africa Advanced Visualization Market Report:
Middle East and Africa grows from $0.38 Billion in 2023 to $0.83 Billion in 2033. Market drivers include investments in healthcare infrastructure, adoption of advanced visualization for training, and gradual enterprise digitization.Tell us your focus area and get a customized research report.
Research Methodology
Advanced Visualization Market Analysis By Product
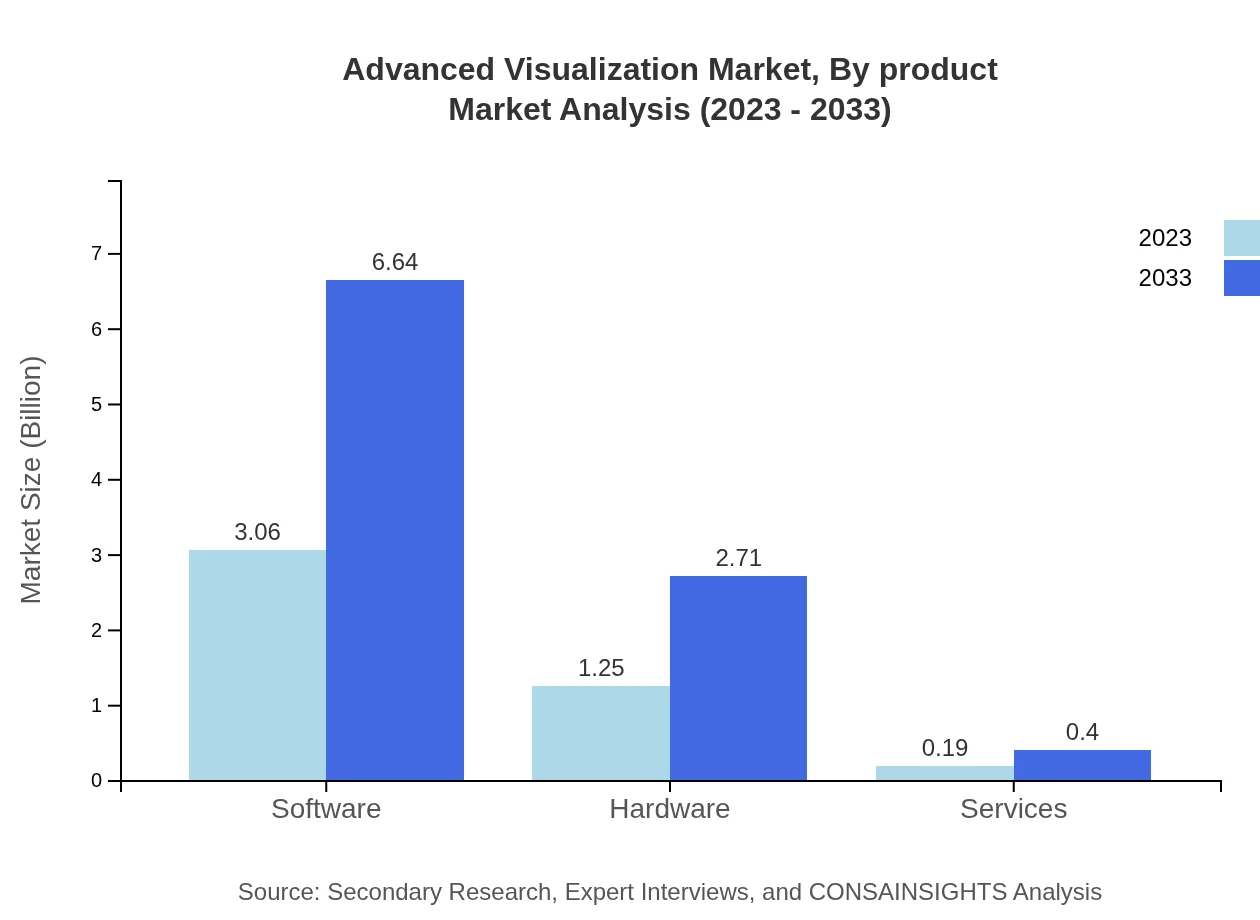
The Advanced Visualization market segmentation by product reveals that the software segment leads the market, anticipated to grow from $3.06 billion in 2023 to $6.64 billion by 2033. Software solutions are widely adopted for data analytics. Following software, the hardware segment is projected to increase from $1.25 billion to $2.71 billion, as organizations invest in powerful hardware for better visualization capabilities. Services represent a smaller portion of the market but are expected to grow modestly from $0.19 billion to $0.40 billion.
Advanced Visualization Market Analysis By Industry
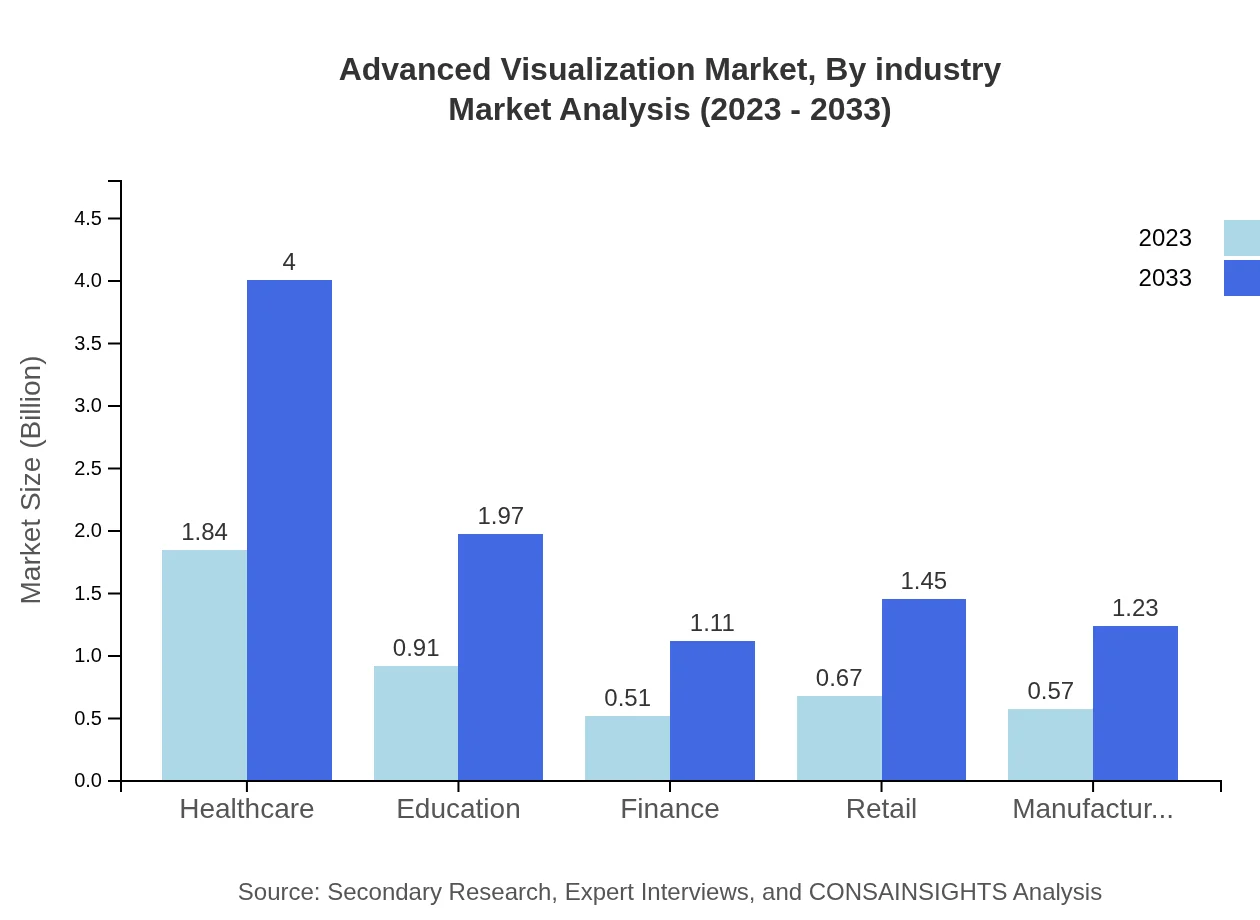
Segmenting by industry, healthcare emerges as the largest sector with a forecasted size of $1.84 billion in 2023, rising to $4.00 billion by 2033. The education sector also shows significant promise, expected to grow from $0.91 billion to $1.97 billion. Other verticals such as finance and retail are likewise poised to expand, reflecting the broad application of visualization technologies.
Advanced Visualization Market Analysis By Technology
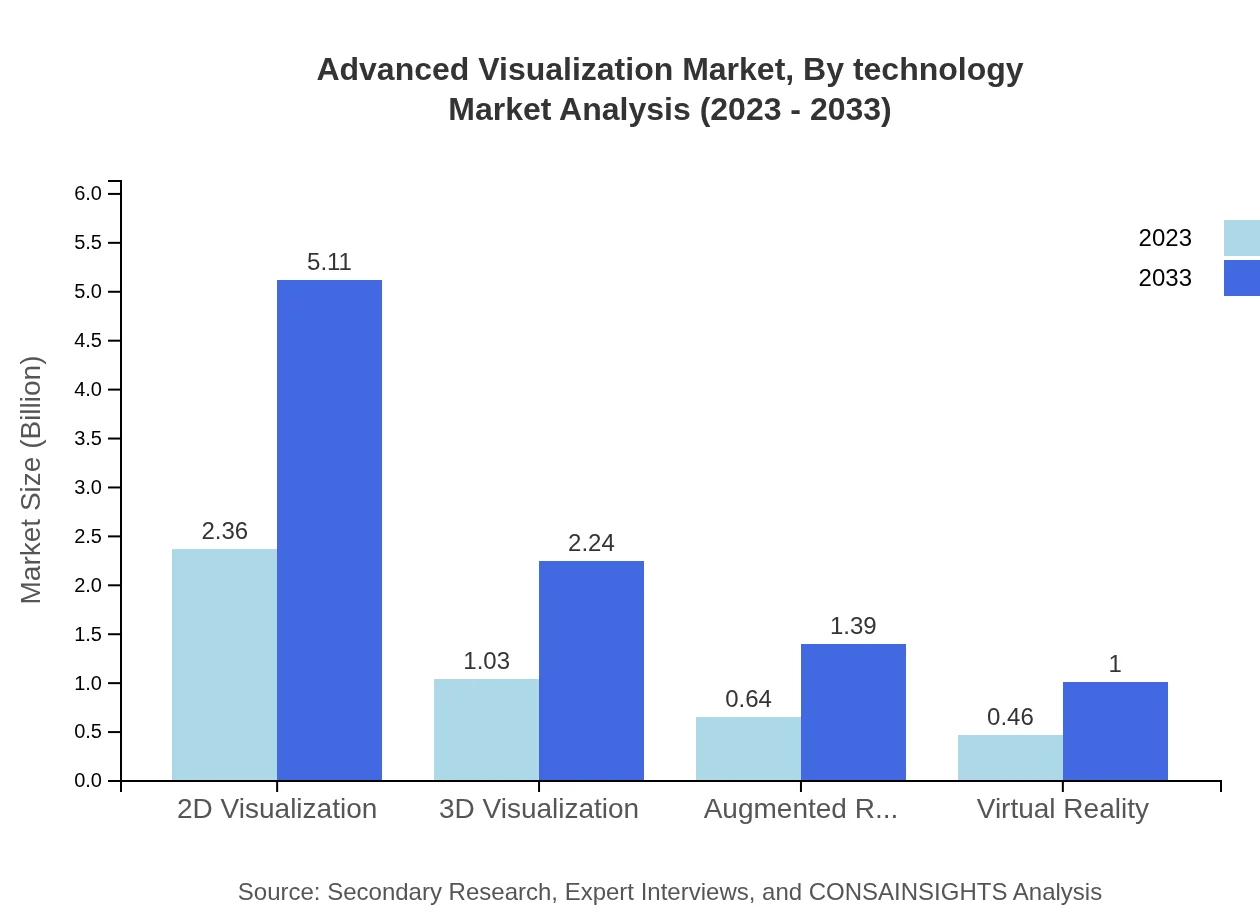
Technologically, 2D visualization dominates with a 2023 market size of $2.36 billion, expected to reach $5.11 billion by 2033, due to its widespread use in traditional applications. Conversely, 3D visualization holds substantial growth potential, predicted to rise from $1.03 billion to $2.24 billion, particularly in sectors like entertainment and manufacturing.
Advanced Visualization Market Analysis By Deployment Type
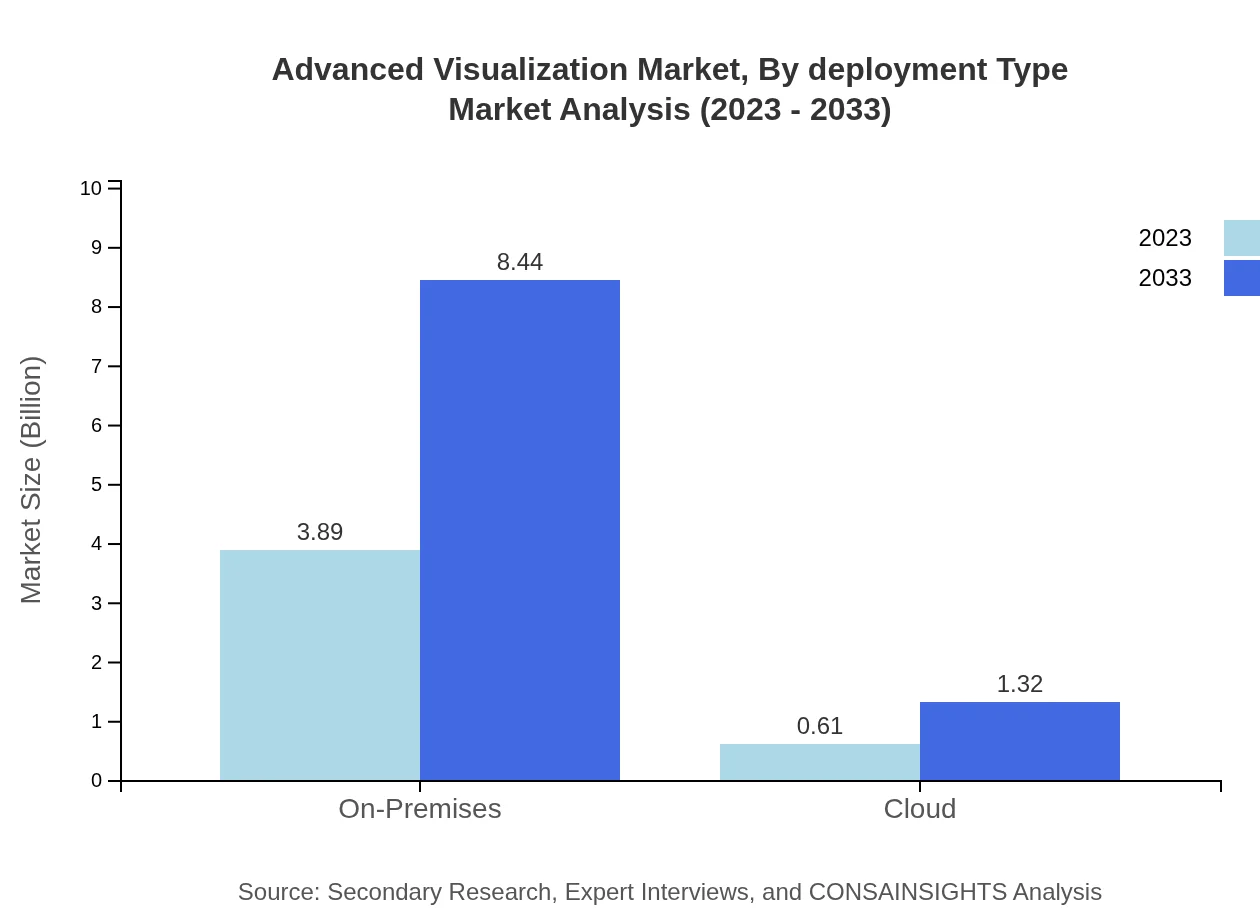
Within the deployment type, on-premises solutions currently dominate the market with a size of $3.89 billion projected for 2023, continuing to lead at $8.44 billion in 2033. Cloud services are also gaining traction, expected to grow from $0.61 billion to $1.32 billion, driven by the need for scalable and accessible visualization solutions.
Advanced Visualization Market Analysis By User Type
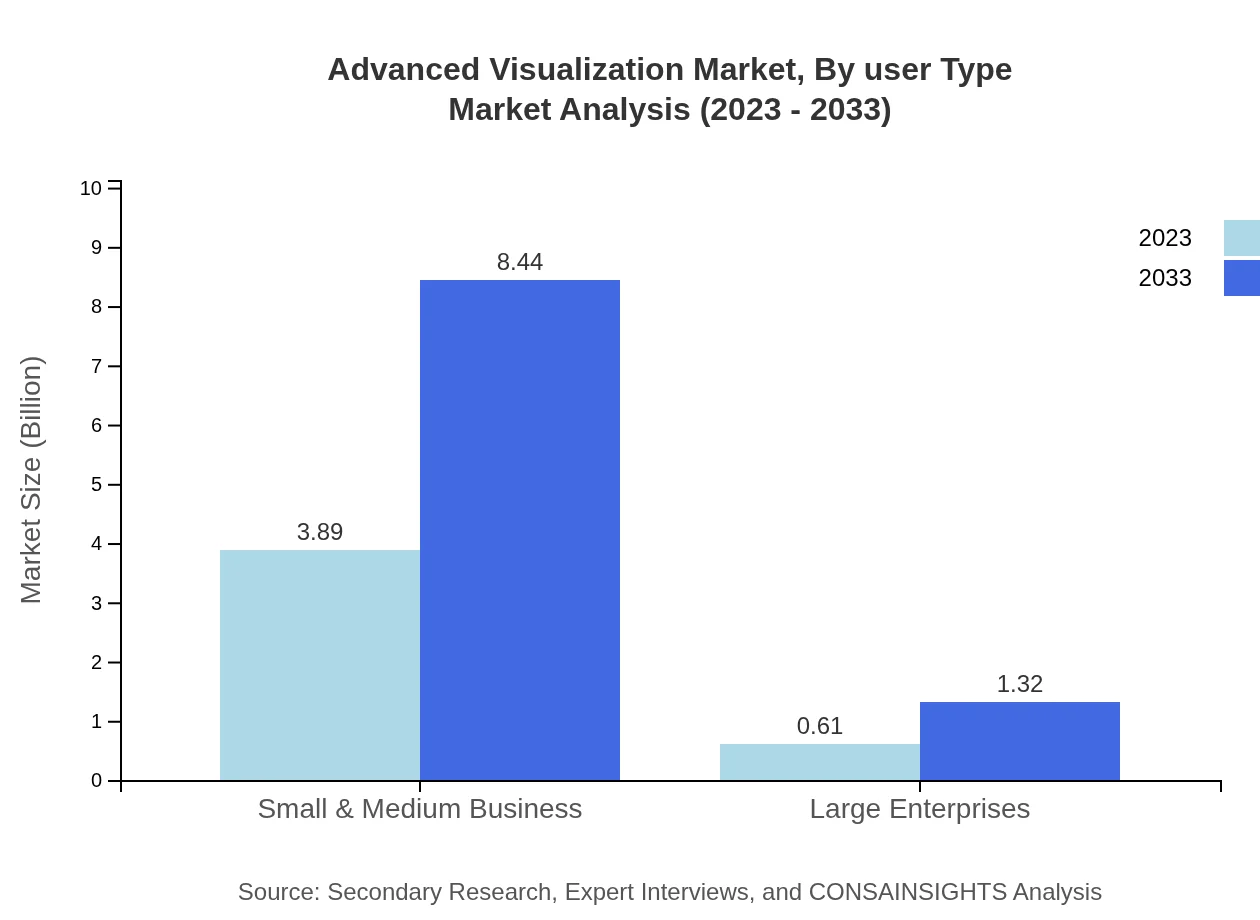
By user type, small and medium businesses represent a substantial share, with a market size of $3.89 billion projected for 2023, due to their increasing adoption of visualization tools for competitive advantage and efficiency. large enterprises are also growing in their use of advanced visualization tools, which are projected to rise from $0.61 billion to $1.32 billion.
Advanced Visualization Market Trends and Future Forecast
Tell us your focus area and get a customized research report.
Global Market Leaders and Top Companies in Advanced Visualization Industry
Siemens Healthineers:
A leading healthcare technology company that provides advanced imaging solutions, playing a significant role in enhancing healthcare visualization in diagnostics.Thermo Fisher Scientific:
Known for its innovative imaging equipment and software that support the life sciences, the company significantly contributes to advanced visualization in various research areas.Autodesk :
A prominent player in 3D modeling, Autodesk leads advancements in visualization software, greatly impacting the architecture and design industries.Tableau Software:
Recognized for its powerful data visualization tools, Tableau enables organizations to analyze and visualize data effectively.NVIDIA:
Pioneering graphics processing units, NVIDIA is instrumental in driving advancements in AR, VR, and AI-based visualization technologies across various sectors.We're grateful to work with incredible clients.









FAQs
What is the market size of the Advanced Visualization market in 2023?
The market size in 2023 is $4.50 Billion, reflecting the baseline for forecast analysis and sector investment planning across product and regional segments.
How big will the market be in 2033?
Projected market value for 2033 is $9.76 Billion, representing the end-point used to calculate the reported 7.8% CAGR for the 2023 to 2033 forecast period.
What is CAGR of the Advanced Visualization market?
The compound annual growth rate for the forecast period 2023 to 2033 is 7.8%, consistent with the market size progression from $4.50 Billion to $9.76 Billion.
Is there a single fastest Growing region in the Advanced Visualization Market Report market?
No single fastest-growing region is stated for the Advanced Visualization Market Report market because the top regional implied CAGR values are within 0.15 percentage points of each other, making the ranking too close to call reliably.
Which companies are leading vendors in this market?
Notable companies named in the report include Siemens Healthineers, Thermo Fisher Scientific, Autodesk, Tableau Software, and NVIDIA as active market participants.
How are deployment models evolving?
Deployment increasingly includes both on-premises and cloud options, enabling organizations to choose scalable or controlled implementations to meet security and performance needs.
What industry verticals use advanced visualization?
Key industries cited include healthcare, education, finance, retail, and manufacturing, which adopt visualization for diagnostics, training, analytics, and operational insights.
What drives demand for immersive technologies?
Adoption of augmented reality and virtual reality for training, simulation, and enhanced user experiences fuels demand, especially where interactive visualization improves outcomes.
Who are primary users of advanced visualization solutions?
User types include Small & Medium Business and Large Enterprises, spanning operational and analytical use cases across multiple industries and deployment preferences.
What are common technology subsegments covered?
Technology categories in the report include 2D Visualization, 3D Visualization, Augmented Reality, and Virtual Reality as distinct capabilities shaping product roadmaps.