
Automated Fare Collection Market Report
Published Date: 02 February 2026 | Report Code: automated-fare-collection
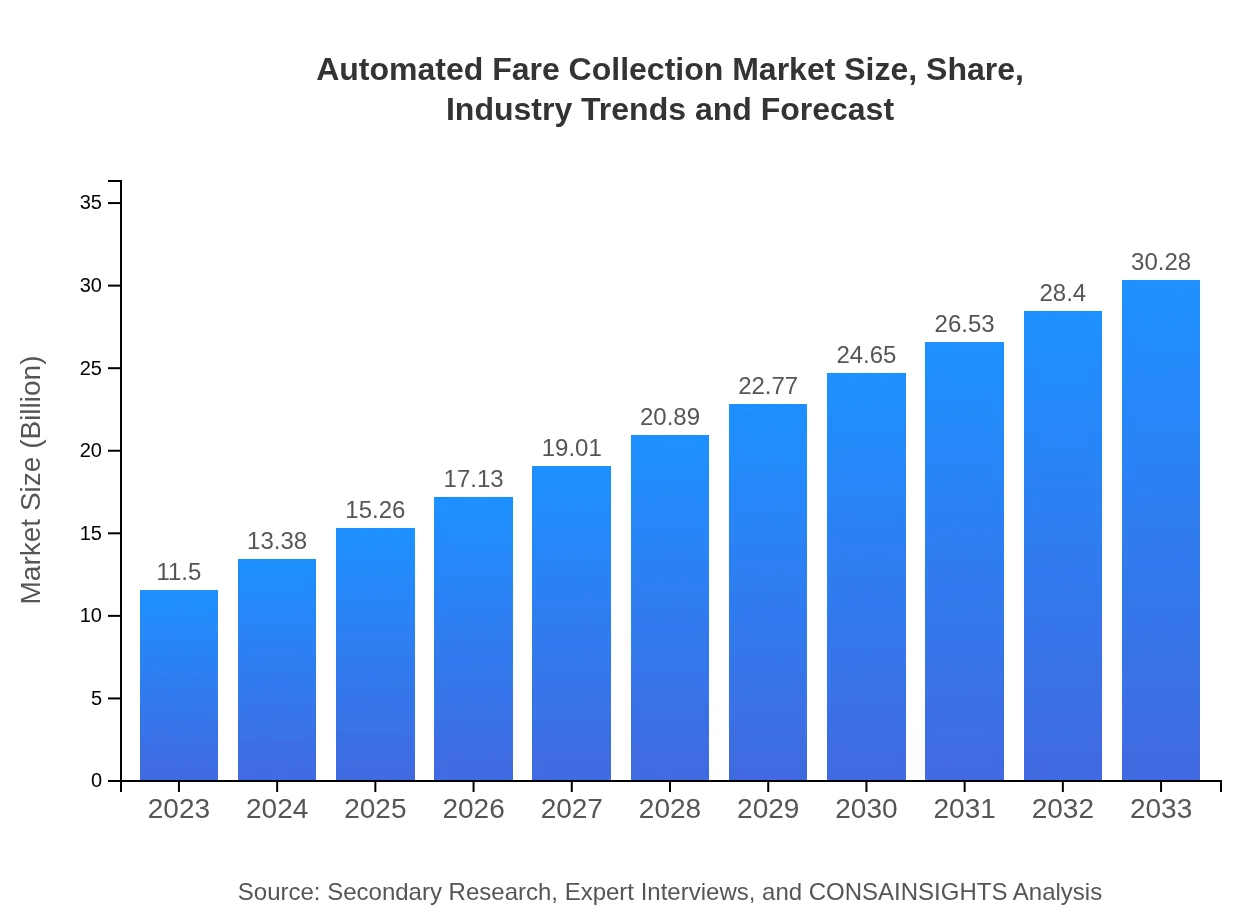
Automated Fare Collection Market Size, Share, Industry Trends and Forecast to 2033
This report provides a comprehensive analysis of the Automated Fare Collection (AFC) market from 2023 to 2033, detailing market size, trends, segment performance, regional developments, and key players in the industry.
| Metric | Value |
|---|---|
| Study Period | 2023 - 2033 |
| 2023 Market Size | $11.50 Billion |
| CAGR (2023-2033) | 9.8% |
| 2033 Market Size | $30.28 Billion |
| Top Companies | Thales Group, Cubic Transportation Systems, Verifone, Accenture |
| Last Modified Date | 02 February 2026 |
Automated Fare Collection Market Overview
Customize Automated Fare Collection Market Report market research report
- ✔ Get in-depth analysis of Automated Fare Collection market size, growth, and forecasts.
- ✔ Understand Automated Fare Collection's regional dynamics and industry-specific trends.
- ✔ Identify potential applications, end-user demand, and growth segments in Automated Fare Collection
What is the Market Size & CAGR of the Automated Fare Collection market in 2023?
Automated Fare Collection Industry Analysis
Automated Fare Collection Market Segmentation and Scope
Tell us your focus area and get a customized research report.
Automated Fare Collection Market Analysis Report by Region
Europe Automated Fare Collection Market Report:
Europe holds one of the largest shares of the AFC market, seeing a value of USD 2.83 billion in 2023 with projections to USD 7.45 billion by 2033. The region's strong focus on smart city developments and sustainable transport solutions significantly boosts the AFC market.Asia Pacific Automated Fare Collection Market Report:
The Asia Pacific market for Automated Fare Collection was valued at approximately USD 2.27 billion in 2023 and is projected to grow to USD 5.99 billion by 2033. Rapid urbanization, a growing population, and increased investment in smart transportation systems are key growth factors in this region.North America Automated Fare Collection Market Report:
North America's AFC market was valued at USD 4.26 billion in 2023 and is anticipated to grow to USD 11.21 billion by 2033. This growth is mainly attributed to advanced technology adoption and increasing public transport ridership coupled with a demand for efficient fare collection systems.South America Automated Fare Collection Market Report:
In South America, the AFC market size was approximately USD 1.03 billion in 2023, expected to reach USD 2.70 billion by 2033. The rise in digital payment methods and government initiatives to modernize transport infrastructures are pivotal to market expansion.Middle East & Africa Automated Fare Collection Market Report:
The AFC market in the Middle East and Africa was valued at USD 1.11 billion in 2023, expected to grow to USD 2.93 billion by 2033. Increasing investment in public transport infrastructure and rising digital payment adoption are key influencers in this region.Tell us your focus area and get a customized research report.
Automated Fare Collection Market Analysis By Technology

The technology segment is diversified, covering smart cards, mobile payment platforms, ticketing systems, and integrated solutions. In 2023, smart cards dominate with a market size of USD 7.33 billion and are projected to account for the same proportion in 2033. Mobile payment solutions and software also represent significant shares with respective sizes of USD 2.84 billion and USD 1.32 billion in 2023, both expected to experience growth aligning with the trend towards digital transactions.
Automated Fare Collection Market Analysis By Application

The key applications of the AFC solutions include public transportation systems, parking management, and event ticketing. Public transportation holds a major share, with a market size estimated at USD 7.33 billion in 2023 and projected to grow substantially. Event venues and parking facilities also contribute to the growth, with their respective shares ensuring comprehensive market reach across various sectors.
Automated Fare Collection Market Analysis By Component
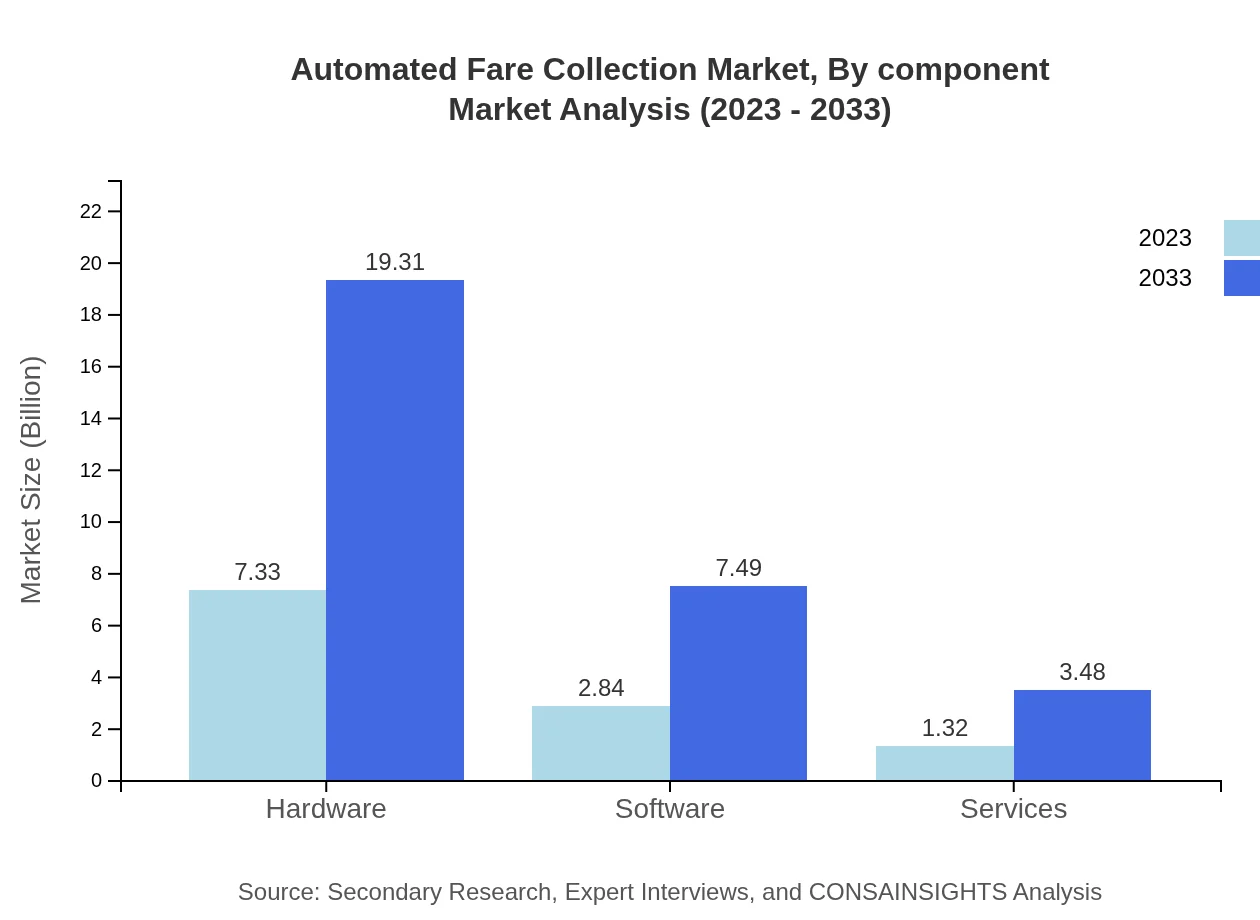
The AFC market comprises components such as hardware, software, and associated services. The hardware segment leads with a market size of USD 7.33 billion in 2023, expected to maintain its dominance as integration with newer technologies evolves. Software solutions, aligning with the growing importance of IT infrastructure in fare collection, also show promising growth potential.
Automated Fare Collection Market Analysis By End User

End-users span across transport operators, automobile companies, and event organizers. Transport operators dominate the market with a sizable footprint of USD 7.33 billion in 2023, reflecting the extensive adoption of AFC systems in urban transit solutions, while automobile companies and event organizers are also notable contributors to market growth with their respective shares.
Automated Fare Collection Market Analysis By Region Type
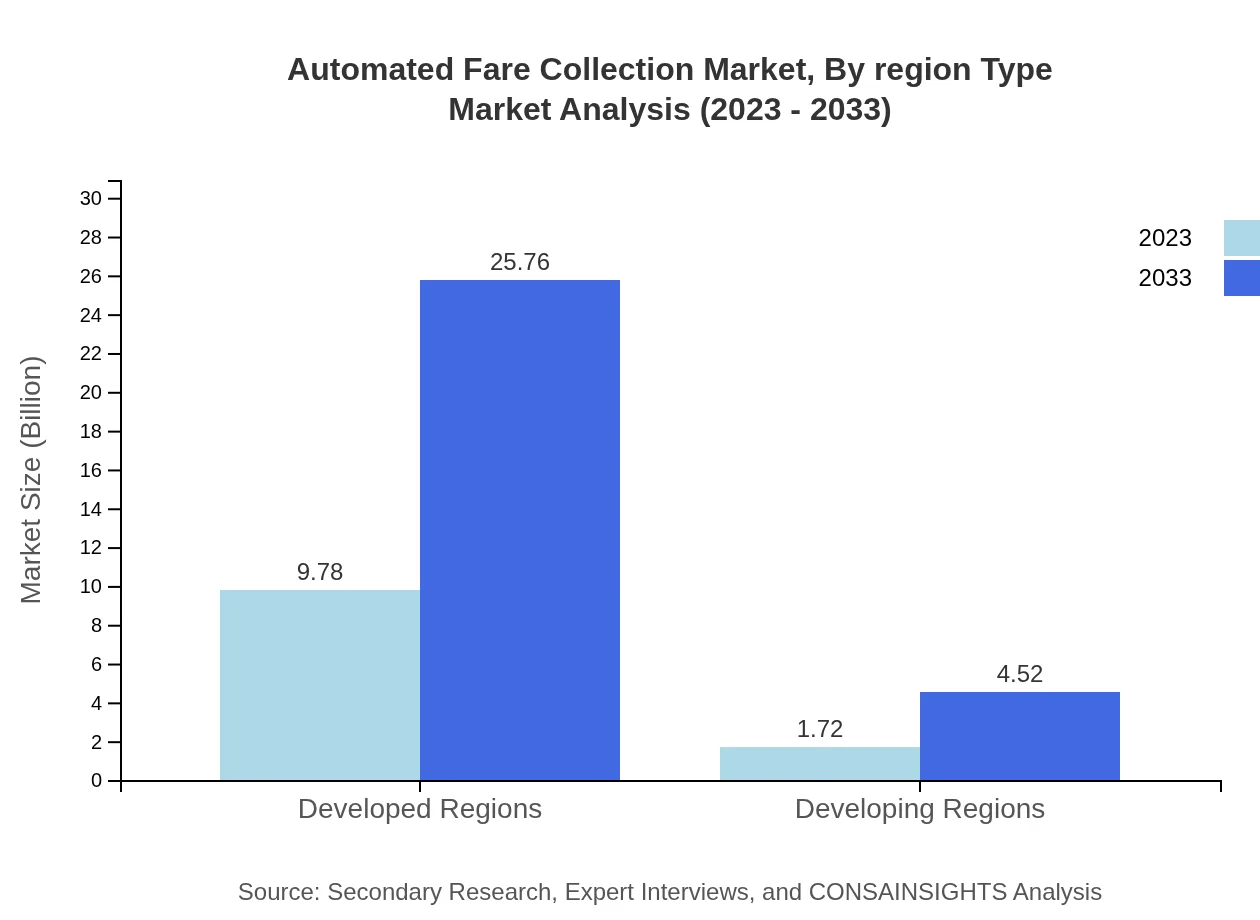
The AFC market exhibits significant divergence in developed and developing regions, with developed regions reflecting a market size of USD 9.78 billion in 2023, showcasing a share of 85.08% of the overall market. Conversely, developing regions represent a smaller but growing segment, with a market share expected to expand from USD 1.72 billion in 2023 and reflecting a share growth as infrastructure investments continue.
Automated Fare Collection Market Trends and Future Forecast
Tell us your focus area and get a customized research report.
Global Market Leaders and Top Companies in Automated Fare Collection Industry
Thales Group:
Thales Group specializes in smart technology solutions, particularly in transportation sectors, offering tailored Automated Fare Collection systems that enhance operational efficiency.Cubic Transportation Systems:
Cubic is a leading provider of automated fare collection systems and intelligent transportation solutions globally, recognized for transforming travel experiences with innovative solutions.Verifone:
Verifone develops advanced payment systems facilitating seamless fare collection processes, focusing on enhancing customer experiences across various transport sectors.Accenture:
Accenture provides consultancy and technology services ensuring effective implementation of AFC systems, aiding clients in optimizing their fare collection methods.We're grateful to work with incredible clients.


FAQs
What is the market size of Automated Fare Collection?
The global Automated Fare Collection market is currently valued at approximately $11.5 billion in 2023, with a projected Compound Annual Growth Rate (CAGR) of 9.8% from 2023 to 2033.
What are the key market players or companies in this Automated Fare Collection industry?
Key players in the Automated Fare Collection market include leading technology companies that provide hardware and software solutions, as well as service providers associated with transport systems to streamline payment processes.
What are the primary factors driving the growth in the Automated Fare Collection industry?
Growth in the Automated Fare Collection industry is driven by increasing urbanization, the rise of smart city initiatives, and the demand for contactless payment options in public and private transport sectors.
Which region is the fastest Growing in the Automated Fare Collection?
The North American region is the fastest-growing market for Automated Fare Collection, growing from $4.26 billion in 2023 to $11.21 billion by 2033, reflecting significant advancements in technology adoption and user convenience.
Does ConsaInsights provide customized market report data for the Automated Fare Collection industry?
Yes, ConsaInsights offers customized market report data tailored to specific needs of clients in the Automated Fare Collection industry, enabling better strategic planning and market positioning.
What deliverables can I expect from this Automated Fare Collection market research project?
Clients can expect comprehensive market analyses, detailed segmentation reports, regional insights, and strategic recommendations, allowing informed decision-making in the Automated Fare Collection space.
What are the market trends of Automated Fare Collection?
Trends in the Automated Fare Collection market include increased adoption of mobile payment solutions, implementation of smart card systems, and enhanced integration of technology in public transportation.