
Bioburden Testing Market Report
Published Date: 31 January 2026 | Report Code: bioburden-testing
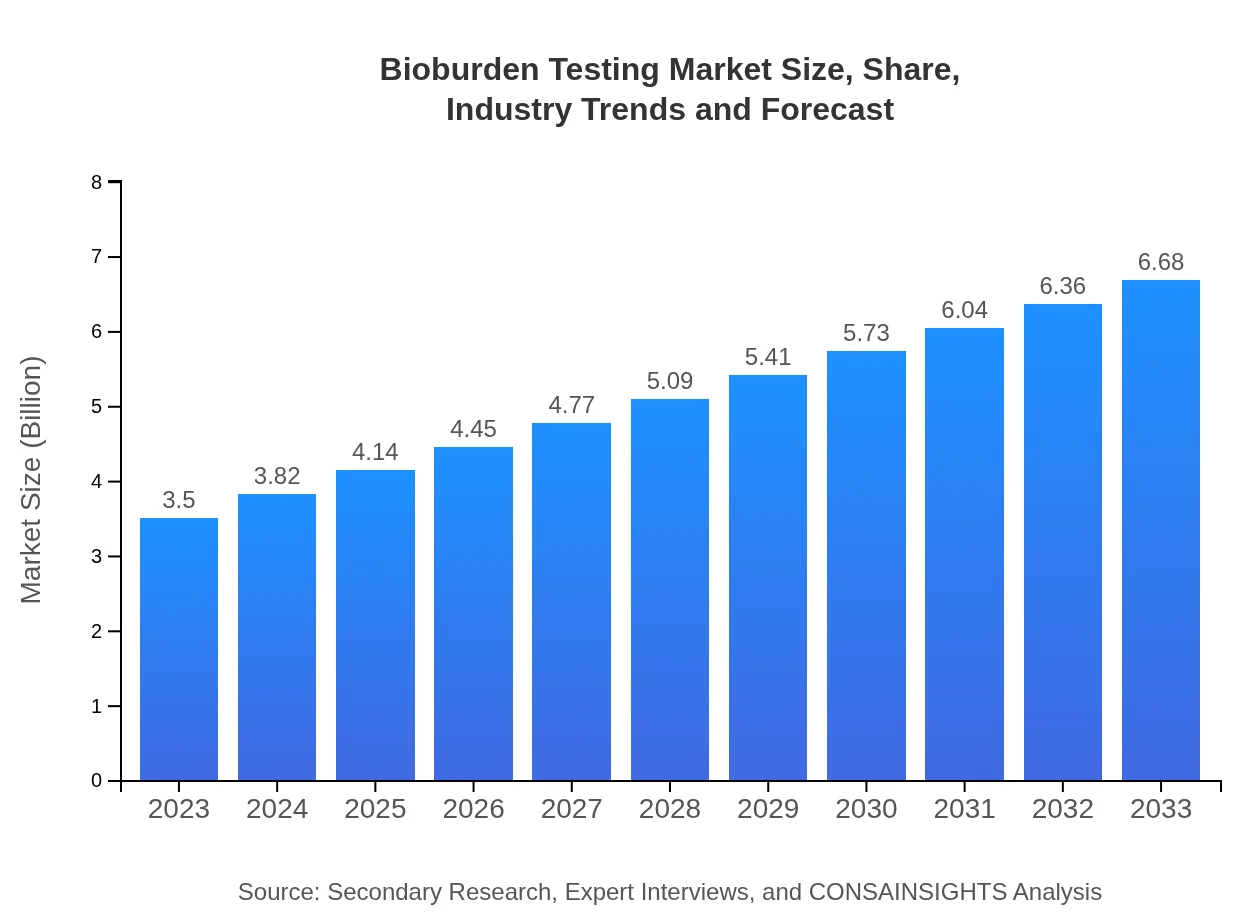
Bioburden Testing Market Size, Share, Industry Trends and Forecast to 2033
This report provides a comprehensive analysis of the Bioburden Testing market from 2023 to 2033, encompassing key insights, trends, market size, growth rates, and regional performance, aimed at stakeholders and industry participants seeking to understand the evolving landscape.
| Metric | Value |
|---|---|
| Study Period | 2023 - 2033 |
| 2023 Market Size | $3.50 Billion |
| CAGR (2023-2033) | 6.5% |
| 2033 Market Size | $6.68 Billion |
| Top Companies | Thermo Fisher Scientific, Merck KGaA, BioMerieux, Charles River Laboratories |
| Last Modified Date | 31 January 2026 |
Bioburden Testing Market Overview
Customize Bioburden Testing Market Report market research report
- ✔ Get in-depth analysis of Bioburden Testing market size, growth, and forecasts.
- ✔ Understand Bioburden Testing's regional dynamics and industry-specific trends.
- ✔ Identify potential applications, end-user demand, and growth segments in Bioburden Testing
What is the Market Size & CAGR of Bioburden Testing market in 2023?
Bioburden Testing Industry Analysis
Bioburden Testing Market Segmentation and Scope
Tell us your focus area and get a customized research report.
Bioburden Testing Market Analysis Report by Region
Europe Bioburden Testing Market Report:
Europe's Bioburden Testing market is anticipated to grow from $1.08 billion in 2023 to $2.06 billion by 2033. The stringent regulatory environment and substantial focus on product safety among European healthcare companies are crucial factors for this growth.Asia Pacific Bioburden Testing Market Report:
The Bioburden Testing market in Asia Pacific is projected to grow from $0.63 billion in 2023 to $1.20 billion by 2033, driven by increasing investments in healthcare and pharmaceuticals alongside greater consumer awareness regarding product safety. Countries like China and India are leading this growth with their expanding healthcare infrastructure.North America Bioburden Testing Market Report:
The North American Bioburden Testing market is the largest, expanding from $1.33 billion in 2023 to an estimated $2.53 billion by 2033. The rise in regulatory compliance and quality assurance measures in the pharmaceutical and medical device industries fuels this rapid growth.South America Bioburden Testing Market Report:
In South America, the Bioburden Testing market size is expected to rise from $0.07 billion in 2023 to $0.13 billion by 2033. The region is experiencing growth due to improved healthcare regulations and a rising demand for quality assurance in various products, though growth might be slower compared to other regions.Middle East & Africa Bioburden Testing Market Report:
The Middle East and Africa market is set to grow from $0.40 billion in 2023 to $0.76 billion by 2033, with increasing investment in healthcare infrastructure and regulatory oversight contributing to a more stringent need for bioburden testing across various products.Tell us your focus area and get a customized research report.
Bioburden Testing Market Analysis By Method

The Bioburden Testing market is primarily driven by methodologies including Membrane Filtration, which is expected to witness significant growth, from $1.97 billion in 2023 to $3.75 billion by 2033. Pour Plate Method follows, with projections moving from $0.81 billion to $1.54 billion. The MPN method and Direct Plating Method are also noteworthy, with similar growth forecasts that reflect increasing standards in microbial testing. Membrane Filtration maintains a market share of 56.19%, illustrating its preferred status among testing methods.
Bioburden Testing Market Analysis By Application
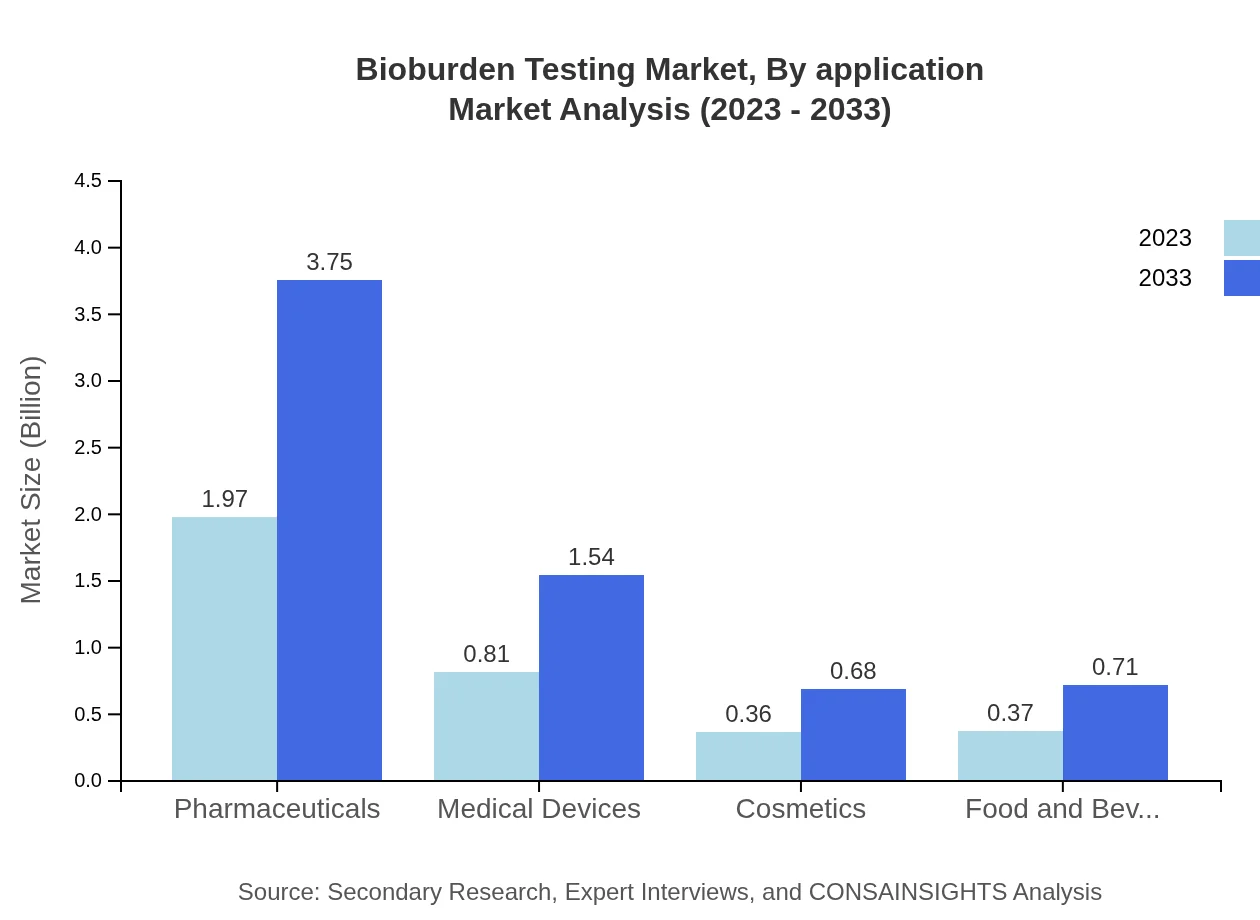
The primary applications of Bioburden Testing include Pharmaceuticals, Medical Devices, and Food & Beverage sectors. Pharmaceuticals dominate with a market size of $4.4 billion in 2023, showcasing a robust market share of 56.19%. Medical Devices follow with a value of $0.81 billion and a share of 23.02%, while Food & Beverage contributes $0.37 billion, demonstrating necessity in maintaining the safety of consumables.
Bioburden Testing Market Analysis By End User
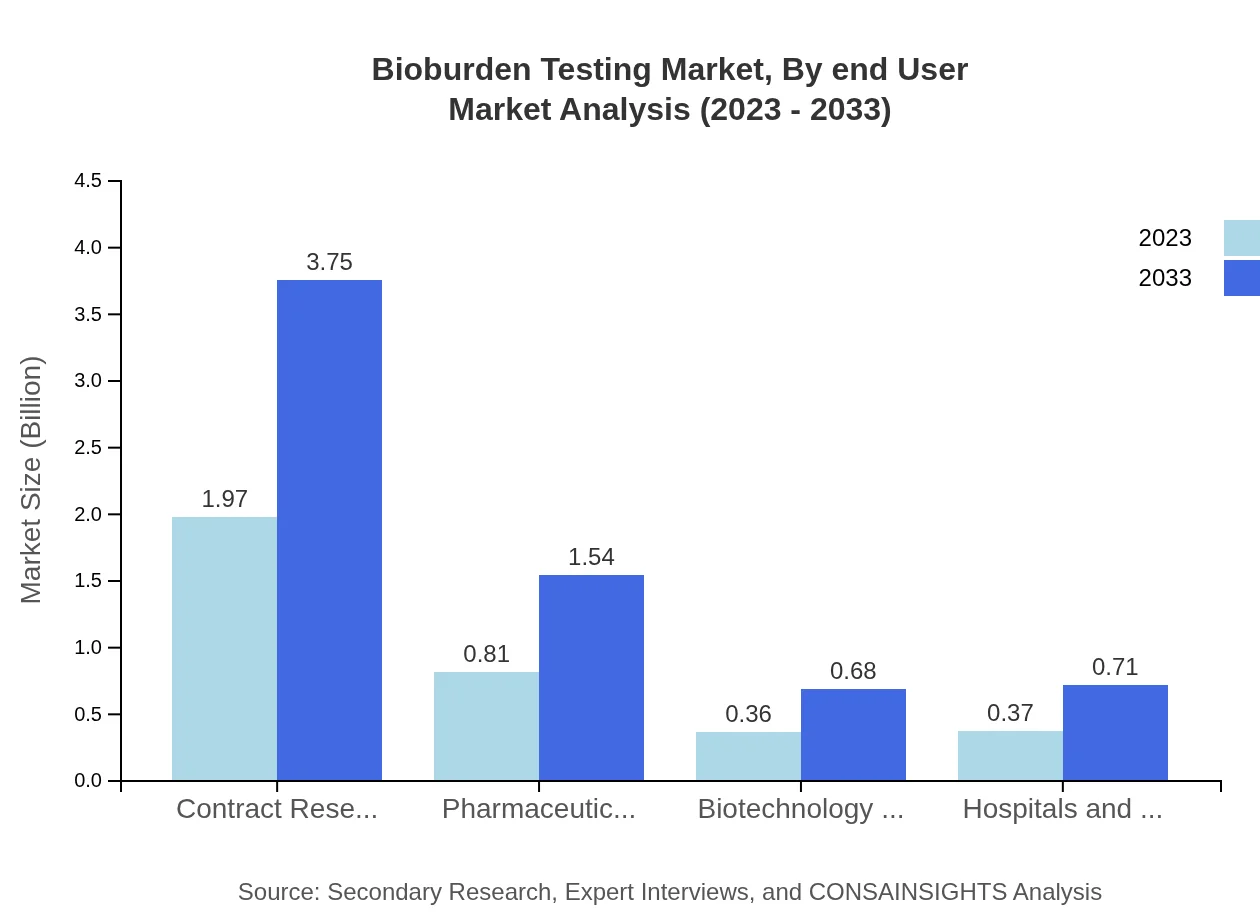
End-users in the Bioburden Testing market predominantly include pharmaceutical companies, biotechnology firms, hospitals and laboratories, with pharmaceutical companies commanding a major share. For instance, pharmaceutical companies accounted for $1.97 billion in 2023, followed by biotechnology firms at $0.36 billion. Each end-user category reflects tailored requirements that bioburden testing must meet to ensure compliance and product safety.
Bioburden Testing Market Analysis By Region
Global Bioburden Testing Market, By Region (For reference only, do not include) Market Analysis (2023 - 2033)
This section outlines the performance of the market by region, capturing insights into growth dynamics and key players tailored to specific geographic segments, although it is excluded from the main content focus.
Bioburden Testing Market Trends and Future Forecast
Tell us your focus area and get a customized research report.
Global Market Leaders and Top Companies in Bioburden Testing Industry
Thermo Fisher Scientific:
Thermo Fisher Scientific is a key player in the bioburden testing market, offering a wide range of solutions including advanced testing instruments and reagents for microbial analysis.Merck KGaA:
Merck KGaA provides innovative bioburden testing solutions and a spectrum of quality control products that enhance safety protocols in pharmaceuticals and food sectors.BioMerieux:
BioMerieux is renowned for its microbiological testing products, contributing significantly to bioburden control in clinical and pharmaceutical environments.Charles River Laboratories:
Charles River Laboratories specializes in biopharmaceutical development, and their bioburden testing services are critical for ensuring product sterility and compliance with industry standards.We're grateful to work with incredible clients.


FAQs
What is the market size of bioburden Testing?
The bioburden testing market is valued at $3.5 billion in 2023, with a projected CAGR of 6.5%. It is anticipated to reach significant growth in the coming years, reflecting heightened regulatory standards and industry needs.
What are the key market players or companies in the bioburden Testing industry?
Key players in the bioburden testing market include contract research organizations, pharmaceutical companies, and biotechnology firms. Their contributions enhance the testing landscape, driven by a focus on safety and regulatory compliance.
What are the primary factors driving the growth in the bioburden testing industry?
Growth drivers include increasing regulatory demands for microbial analysis, a rise in pharmaceuticals and medical devices production, and stringent quality control in biotechnology. These factors necessitate advanced bioburden testing solutions.
Which region is the fastest Growing in the bioburden testing market?
North America stands as the fastest-growing region, with the bioburden testing market projected to grow from $1.33 billion in 2023 to $2.53 billion by 2033. This growth is driven by stringent regulatory frameworks and a robust biotech sector.
Does Consainsights provide customized market report data for the bioburden testing industry?
Yes, Consainsights offers tailored market reports for the bioburden testing industry, allowing clients to access specific data and insights tailored to their business needs, enhancing strategic decision-making.
What deliverables can I expect from this bioburden testing market research project?
Deliverables include comprehensive market analysis reports, segmentation data, growth forecasts, competitor profiling, and strategic recommendations, ensuring clients receive actionable insights to drive their business objectives.
What are the market trends of bioburden testing?
Current trends in bioburden testing include increasing automation in testing processes, adoption of rapid testing methodologies, and a growing focus on environmental monitoring, reflecting advancing technology in the field.