Reports >
Technology And Media
>
Bring-your-own-Device (BYOD)

Bring-your-own-Device (BYOD)
Published Date: 31 January 2026 | Report Code: bring-your-own-device-byod
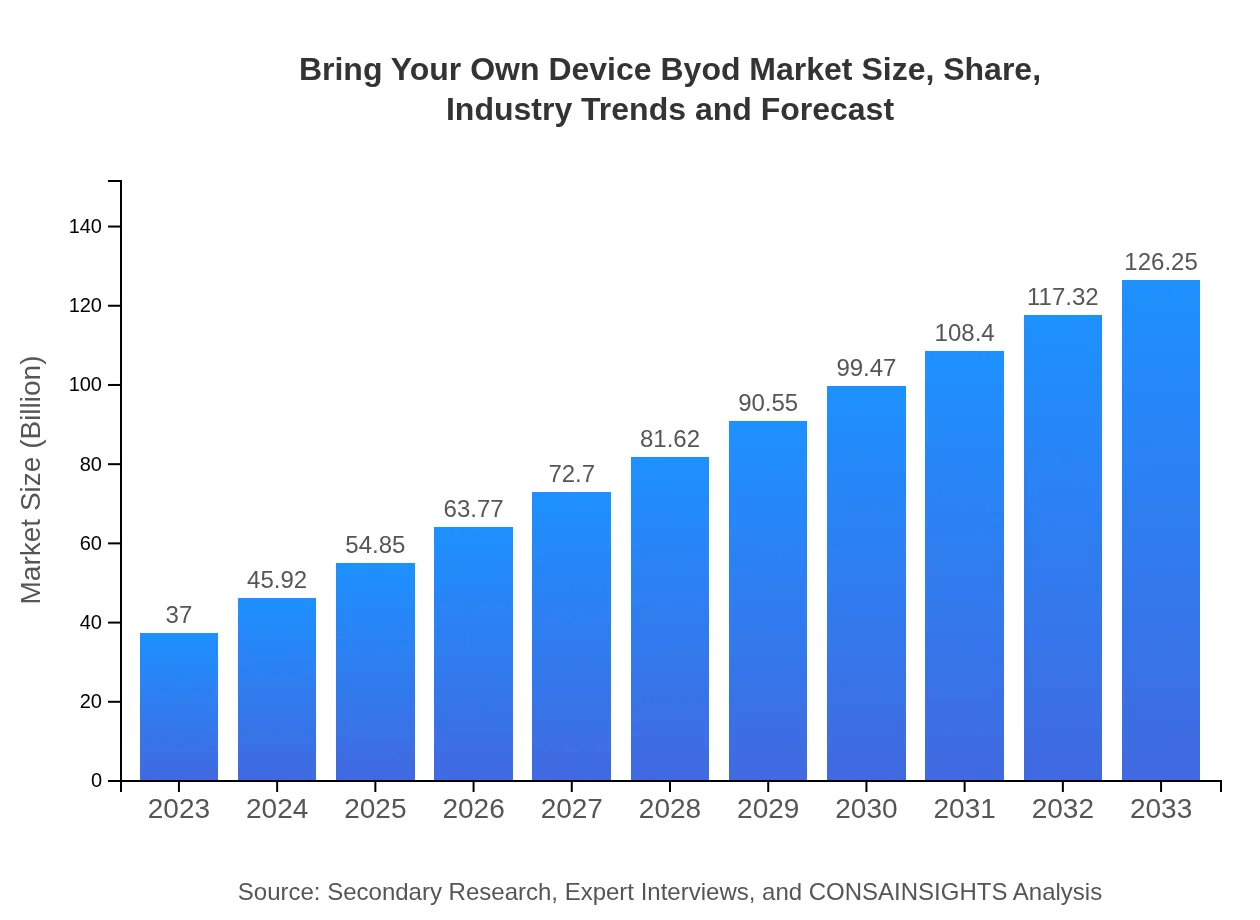
Bring Your Own Device Byod Market Size, Share, Industry Trends and Forecast to 2033
This report provides a comprehensive analysis of the Bring Your Own Device (BYOD) market, examining current conditions, trends, and forecasts from 2023 to 2033. Insights include market sizes, growth rates, regional performances, industry analysis, and key players.
| Metric | Value |
|---|---|
| Study Period | 2023 - 2033 |
| 2023 Market Size | $37.00 Billion |
| CAGR (2023-2033) | 12.5% |
| 2033 Market Size | $126.25 Billion |
| Top Companies | Cisco Systems, Inc., VMware, Inc., Microsoft Corporation, Citrix Systems, Inc., IBM Corporation |
| Last Modified Date | 31 January 2026 |
Bring Your Own Device Byod Market Overview
Customize Bring-your-own-Device (BYOD) market research report
- ✔ Get in-depth analysis of Bring Your Own Device Byod market size, growth, and forecasts.
- ✔ Understand Bring Your Own Device Byod's regional dynamics and industry-specific trends.
- ✔ Identify potential applications, end-user demand, and growth segments in Bring Your Own Device Byod
What is the Market Size & CAGR of Bring Your Own Device Byod market in 2023?
Bring Your Own Device Byod Industry Analysis
Bring Your Own Device Byod Market Segmentation and Scope
Tell us your focus area and get a customized research report.
Bring Your Own Device Byod Market Analysis Report by Region
Europe Bring-your-own-Device (BYOD):
The European BYOD market is estimated to rise from $9.77 billion in 2023 to $33.34 billion in 2033. GDPR regulations and an increasing focus on data security are pushing organizations to refine their BYOD policies continually. As industries recognize the competitive advantage brought about by flexible working, the market is predicted to see substantial growth.Asia Pacific Bring-your-own-Device (BYOD):
In the Asia Pacific region, the BYOD market is forecasted to grow from $7.41 billion in 2023 to $25.29 billion by 2033. The rise in digital adoption and flexible working arrangements in countries like India, China, and Japan significantly bolster this growth. Organizations are increasingly investing in MDM and cybersecurity to ensure safe device usage, making Asia Pacific a key player in the BYOD landscape.North America Bring-your-own-Device (BYOD):
North America is currently the largest market for BYOD, expected to grow from $12.07 billion in 2023 to $41.17 billion by 2033. The region benefits from high rates of smartphone adoption and a robust IT infrastructure. Corporations are rapidly adopting BYOD practices, driven by the quest for enhanced productivity and employee flexibility, alongside advanced security solutions becoming widely available.South America Bring-your-own-Device (BYOD):
South America shows a promising trajectory, with the BYOD market projected to increase from $2.97 billion in 2023 to $10.15 billion in 2033. Factors such as improved internet infrastructure and growing mobile device penetration contribute to this expansion. However, security concerns remain a major challenge that must be addressed to fully realize the BYOD potential.Middle East & Africa Bring-your-own-Device (BYOD):
The Middle East and Africa BYOD market is anticipated to grow from $4.78 billion in 2023 to $16.30 billion by 2033. The shift towards digital workplaces and increasing smartphone usage impact this development positively. Nonetheless, the region faces unique challenges, including specific infrastructure and regulatory issues that need addressing for seamless BYOD implementation.Tell us your focus area and get a customized research report.
Bring Your Own Device Byod Market Analysis By Device Type

In terms of device type, the market is led by smartphones, with a projected value increase from $23.67 billion in 2023 to $80.75 billion in 2033, capturing a 63.96% market share. Tablets and laptops also play significant roles, with expected values of $8.57 billion to $29.23 billion and $4.77 billion to $16.27 billion, respectively. Each device type's performance highlights the trend towards an increasing preference for portable and flexible devices for professional use.
Bring Your Own Device Byod Market Analysis By Industry
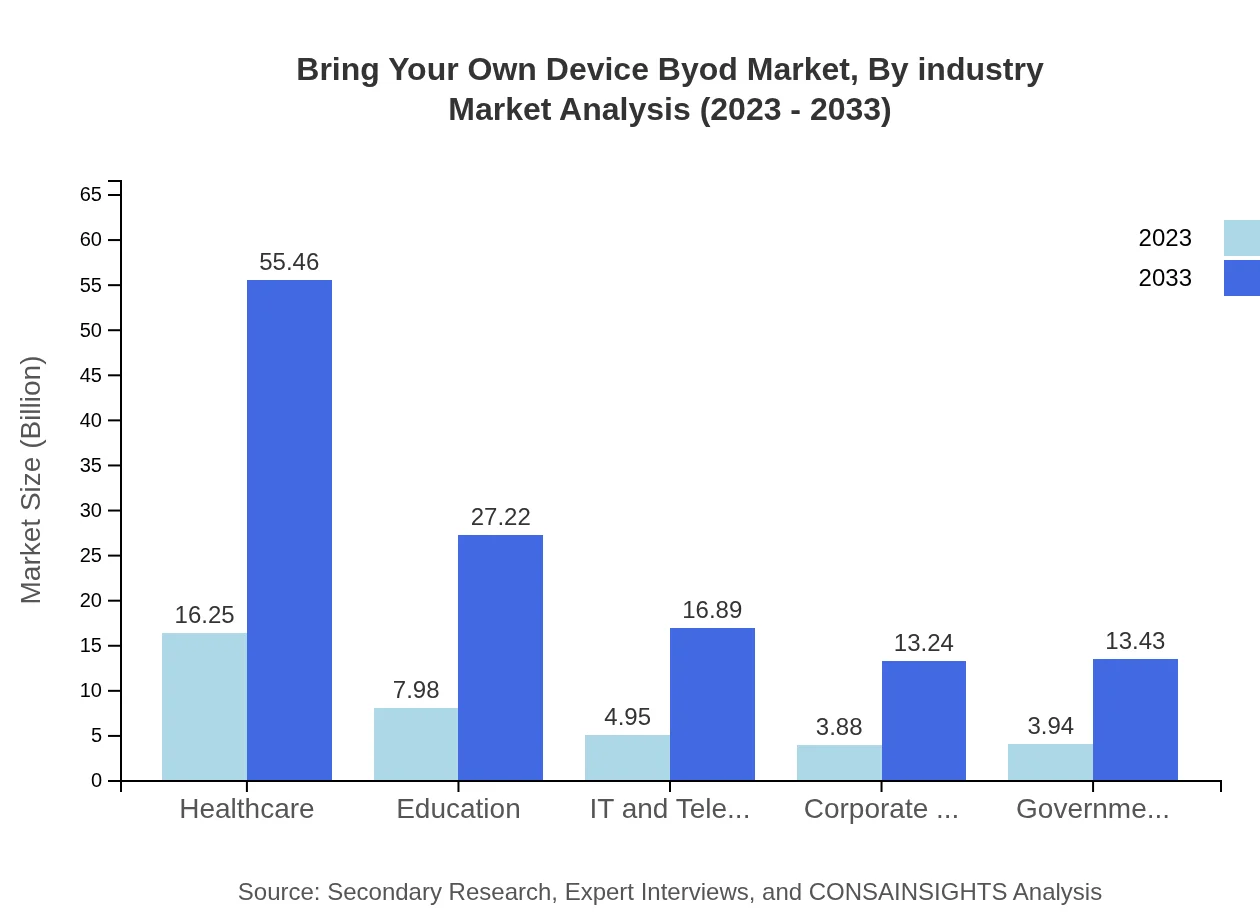
The healthcare sector leads the BYOD market with an anticipated growth from $16.25 billion in 2023 to $55.46 billion in 2033, accounting for a substantial 43.93% market share due to regulatory requirements for mobility and access to medical records. Education also shows noteworthy growth from $7.98 billion to $27.22 billion, earning a share of 21.56%. The IT and telecom sector grows from $4.95 billion to $16.89 billion with a 13.38% share, reflecting the necessity of mobile devices in managing operations efficiently.
Bring Your Own Device Byod Market Analysis By Security Solution
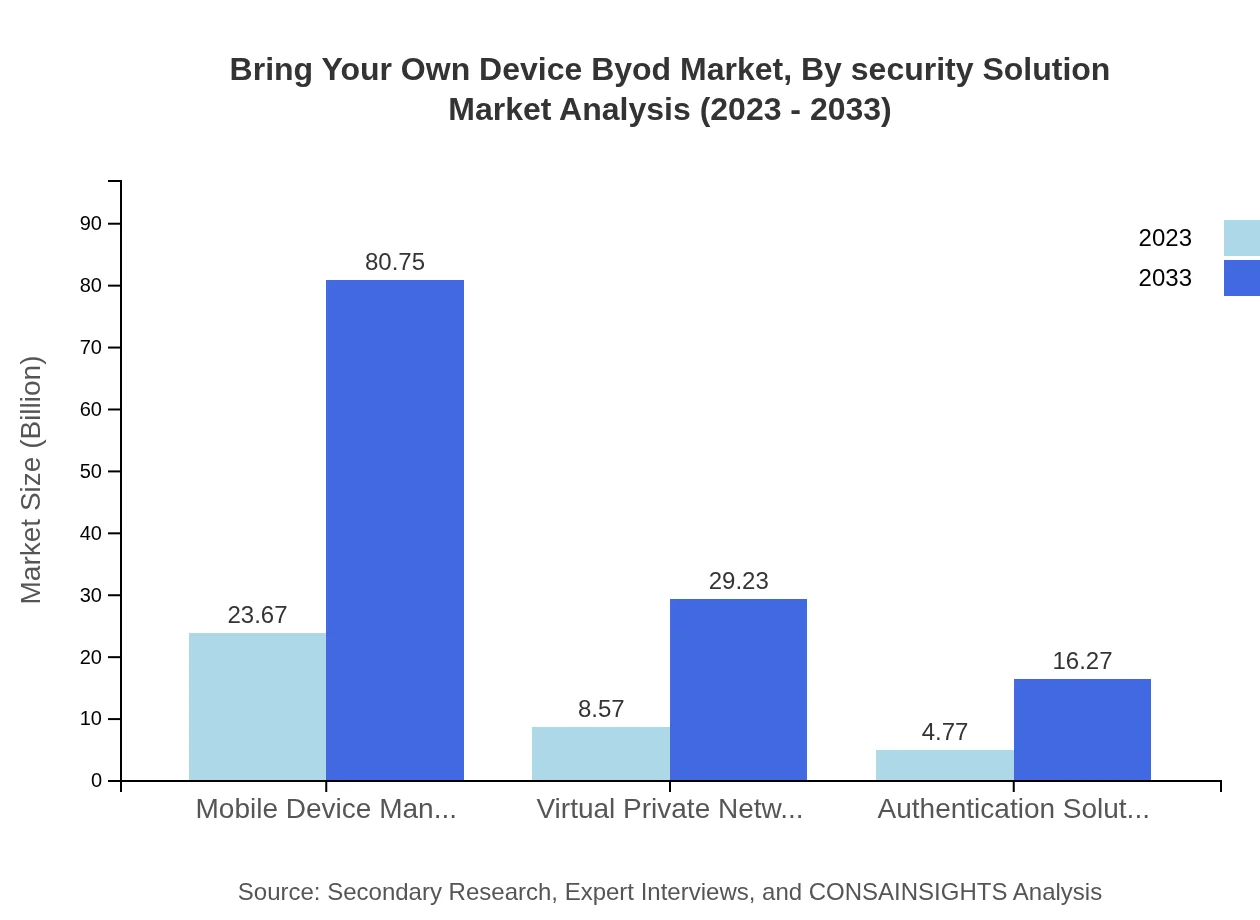
Security solutions are inherently critical to the BYOD ecosystem, with Mobile Device Management (MDM) leading this segment, set to grow from $23.67 billion in 2023 to $80.75 billion in 2033, maintaining a 63.96% market share. Virtual Private Networks (VPNs) and authentication solutions are also key components, anticipated to grow in tandem as organizations prioritize securing personal devices accessing corporate networks. Robust security implementations are crucial to gain full benefits from BYOD practices.
Bring Your Own Device Byod Market Analysis By Deployment Model
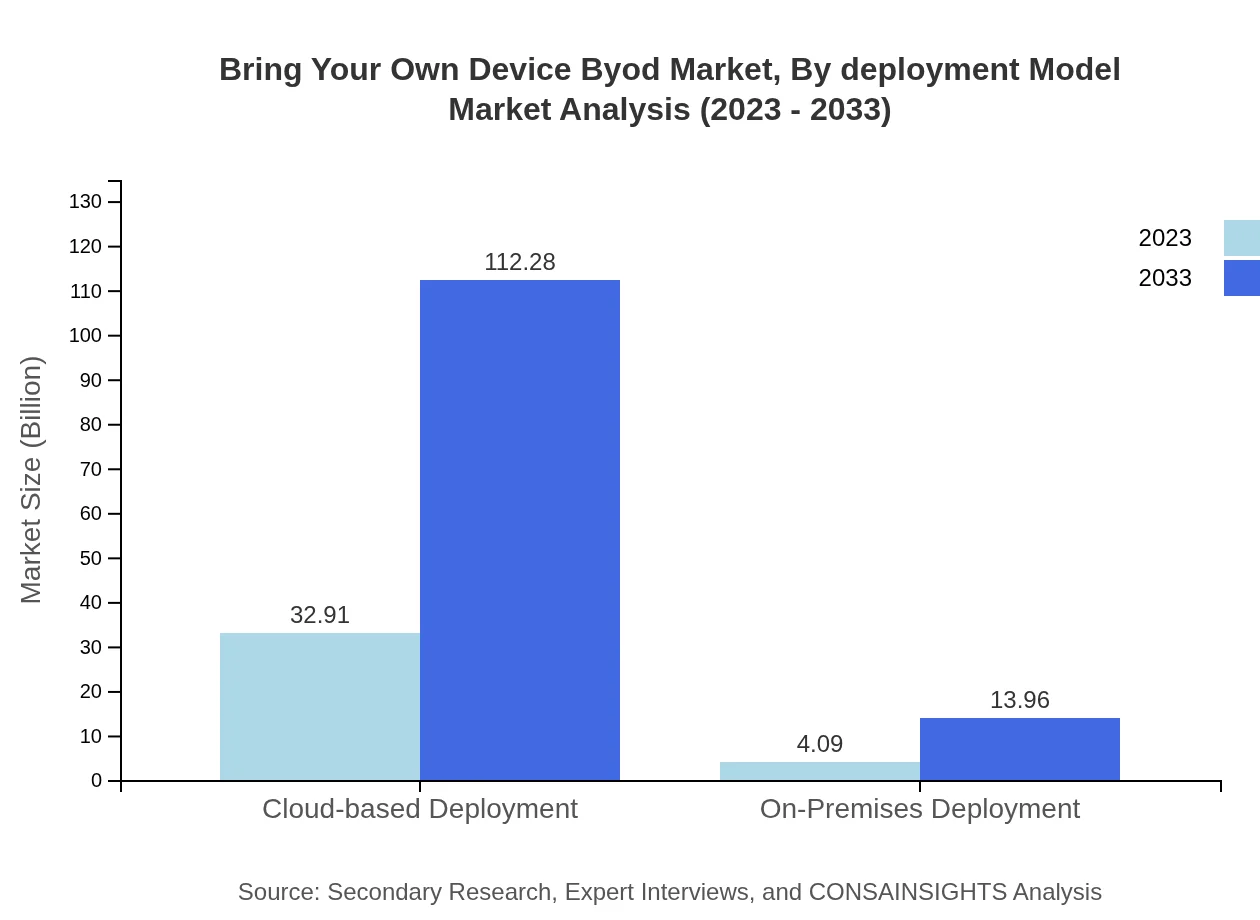
The BYOD market can be divided into cloud-based and on-premises deployment models. A clear trend is visible with cloud-based deployments expected to surge from $32.91 billion in 2023 to $112.28 billion in 2033, dominating the market with an 88.94% share. This surge is influenced by the flexibility, cost-effectiveness, and scalability of cloud solutions. Conversely, the on-premises deployment will grow from $4.09 billion to $13.96 billion, attributing to businesses with strict compliance needs and data control requirements.
Bring Your Own Device Byod Market Analysis By Service Type

Consulting services are essential in guiding organizations through BYOD implementations, with a projected increase from $23.67 billion in 2023 to $80.75 billion by 2033. This segment also constitutes a 63.96% market share. Other service types, including IT support services and integration services, follow closely in significance, ensuring organizations can adopt BYOD smoothly and effectively manage ongoing technical support.
Bring Your Own Device Byod Market Trends and Future Forecast
Tell us your focus area and get a customized research report.
Global Market Leaders and Top Companies in Bring Your Own Device Byod Industry
Cisco Systems, Inc.:
A leader in networking solutions, Cisco offers a comprehensive portfolio of security products designed for managing BYOD environments, enhancing mobile security and device management capabilities.VMware, Inc.:
VMware specializes in cloud infrastructure and digital workspace technology, providing solutions that enable businesses to implement BYOD policies securely and efficiently.Microsoft Corporation:
Microsoft is a significant player in the BYOD market through its suite of productivity and security solutions, including Azure Active Directory and Microsoft 365, which facilitate secure access to enterprise applications on personal devices.Citrix Systems, Inc.:
Citrix delivers virtualization technology that allows secure remote access to applications and data, supporting BYOD initiatives while ensuring effective security measures are in place.IBM Corporation:
IBM provides comprehensive industry and workplace solutions, including mobile security and management tools to businesses implementing BYOD strategies across various sectors.We're grateful to work with incredible clients.


FAQs
What is the market size of Bring Your Own Device (BYOD)?
The Bring Your Own Device (BYOD) market is currently valued at $37 billion, with a projected CAGR of 12.5% through 2033. This growth is indicative of increasing workforce mobility and more enterprises embracing BYOD policies.
What are the key market players or companies in the BYOD industry?
Key players in the BYOD market include IBM, Citrix, VMware, and Microsoft. These companies lead in providing solutions for mobile device management and secure access for BYOD environments, shaping the industry's future and technological advancements.
What are the primary factors driving the growth in the BYOD industry?
Growth in the BYOD market is driven by rising mobile device usability, increased workforce mobility desires, enhanced cloud-based services, and a growing emphasis on employee productivity and satisfaction in organizations across diverse sectors.
Which region is the fastest Growing in the BYOD market?
The fastest-growing region in the BYOD market is North America, projected to expand from $12.07 billion in 2023 to $41.17 billion by 2033. This surge is attributed to advanced technological infrastructure and widespread adoption of mobile solutions.
Does ConsaInsights provide customized market report data for the BYOD industry?
Yes, ConsaInsights offers customized market report data tailored to specific needs in the BYOD industry. Clients can request detailed insights that fit their unique requirements, ensuring informed decision-making.
What deliverables can I expect from this BYOD market research project?
Delivers include comprehensive market analysis reports, segmentation data by region and type, competitive landscape assessments, industry forecasts, and insights into trends influencing BYOD adoption in various sectors.
What are the market trends of BYOD?
Key trends in the BYOD market encompass enhanced security measures, growing reliance on cloud technologies, increasing adoption of mobile device management solutions, and rising integration of Artificial Intelligence to manage and secure devices more efficiently.