
Business Intelligence Market Report
Published Date: 31 January 2026 | Report Code: business-intelligence
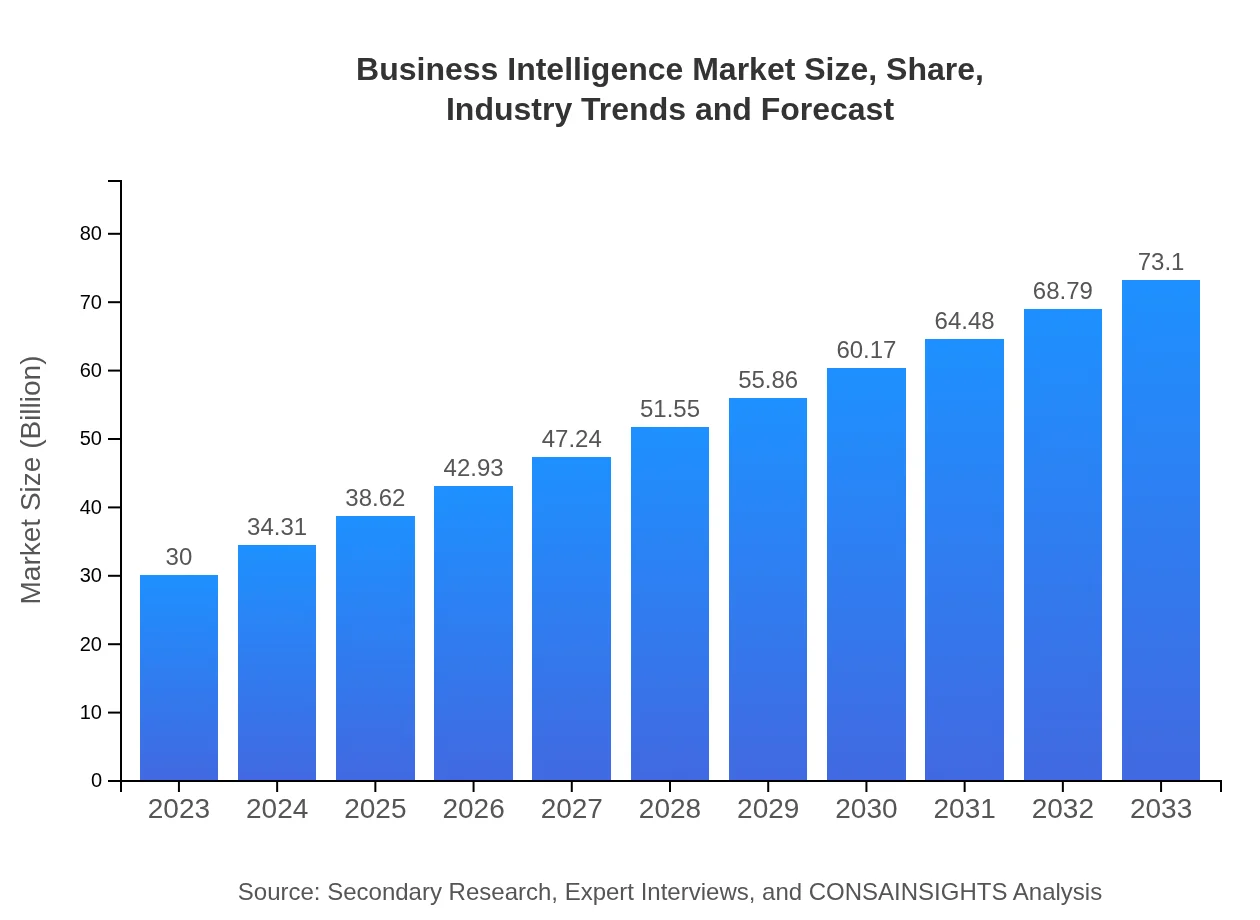
Business Intelligence Market Size, Share, Industry Trends and Forecast to 2033
This report provides an in-depth analysis of the Business Intelligence market, including market size, growth forecast, and technology trends from 2023 to 2033. It aims to deliver valuable insights on industry dynamics and regional performances.
| Metric | Value |
|---|---|
| Study Period | 2023 - 2033 |
| 2023 Market Size | $30.00 Billion |
| CAGR (2023-2033) | 9% |
| 2033 Market Size | $73.10 Billion |
| Top Companies | Microsoft, IBM, Tableau, SAP |
| Last Modified Date | 31 January 2026 |
Business Intelligence Market Overview
Customize Business Intelligence Market Report market research report
- ✔ Get in-depth analysis of Business Intelligence market size, growth, and forecasts.
- ✔ Understand Business Intelligence's regional dynamics and industry-specific trends.
- ✔ Identify potential applications, end-user demand, and growth segments in Business Intelligence
What is the Market Size & CAGR of Business Intelligence Market in 2023?
Business Intelligence Industry Analysis
Business Intelligence Market Segmentation and Scope
Tell us your focus area and get a customized research report.
Business Intelligence Market Analysis Report by Region
Europe Business Intelligence Market Report:
In Europe, the Business Intelligence market is expected to expand from $7.58 billion in 2023 to $18.48 billion by 2033. The region is characterized by robust data privacy regulations, which prompt organizations to seek sophisticated BI solutions that balance compliance with analytics.Asia Pacific Business Intelligence Market Report:
The Asia Pacific region is rapidly emerging as a significant player in the Business Intelligence market, projected to grow from $6.01 billion in 2023 to $14.64 billion by 2033. The rapid adoption of digital technologies in countries like China, India, and Japan, alongside a predominating focus on data-driven strategies, boosts market growth in this region.North America Business Intelligence Market Report:
North America remains the largest market for Business Intelligence, with anticipated growth from $10.15 billion in 2023 to $24.73 billion by 2033. The region's advanced technological infrastructure and a high concentration of innovative companies contribute significantly to the market advancements here.South America Business Intelligence Market Report:
The South American market, although smaller, is expected to increase from $2.11 billion in 2023 to $5.14 billion by 2033. This growth is largely attributed to the increasing penetration of technology in businesses, alongside governmental initiatives aimed at fostering digital transformation within the region.Middle East & Africa Business Intelligence Market Report:
The Middle East and Africa market for Business Intelligence is projected to grow from $4.15 billion in 2023 to $10.12 billion by 2033. The increasing adoption of cloud-based technologies plays a pivotal role in this growth, and organizations are keen on leveraging data analytics for enhanced operational efficiency.Tell us your focus area and get a customized research report.
Business Intelligence Market Analysis By Product
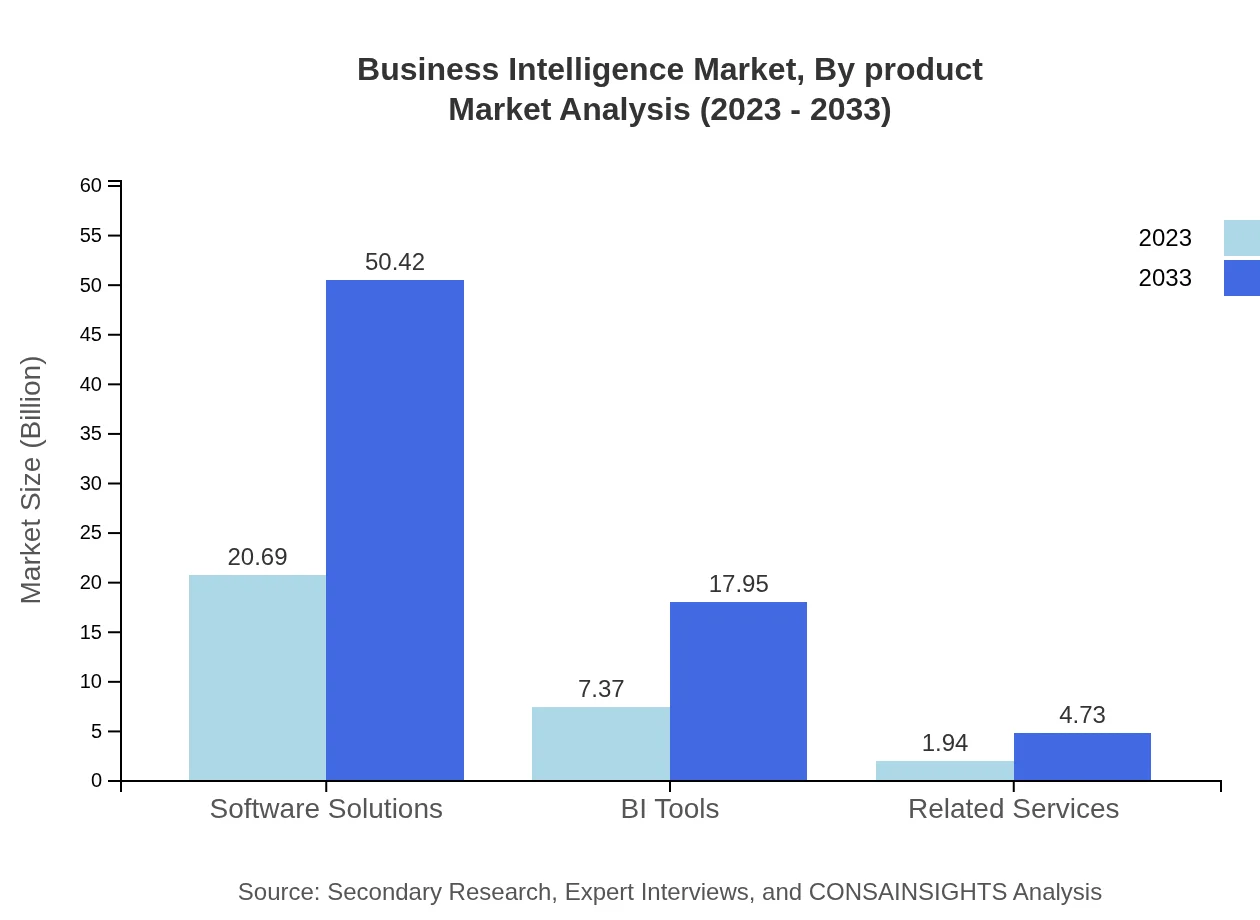
The Business Intelligence market exhibits strong performance in the software solutions segment, expected to grow significantly from $20.69 billion in 2023 to $50.42 billion by 2033, reflecting a robust industry demand. BI Tools also showcase a promising trajectory, increasing from $7.37 billion to $17.95 billion over the same period, demonstrating their essential role in data analysis across various sectors. Related services, though smaller in size, are also expected to see growth, from $1.94 billion to $4.73 billion, highlighting the service-oriented nature of the BI market.
Business Intelligence Market Analysis By Application
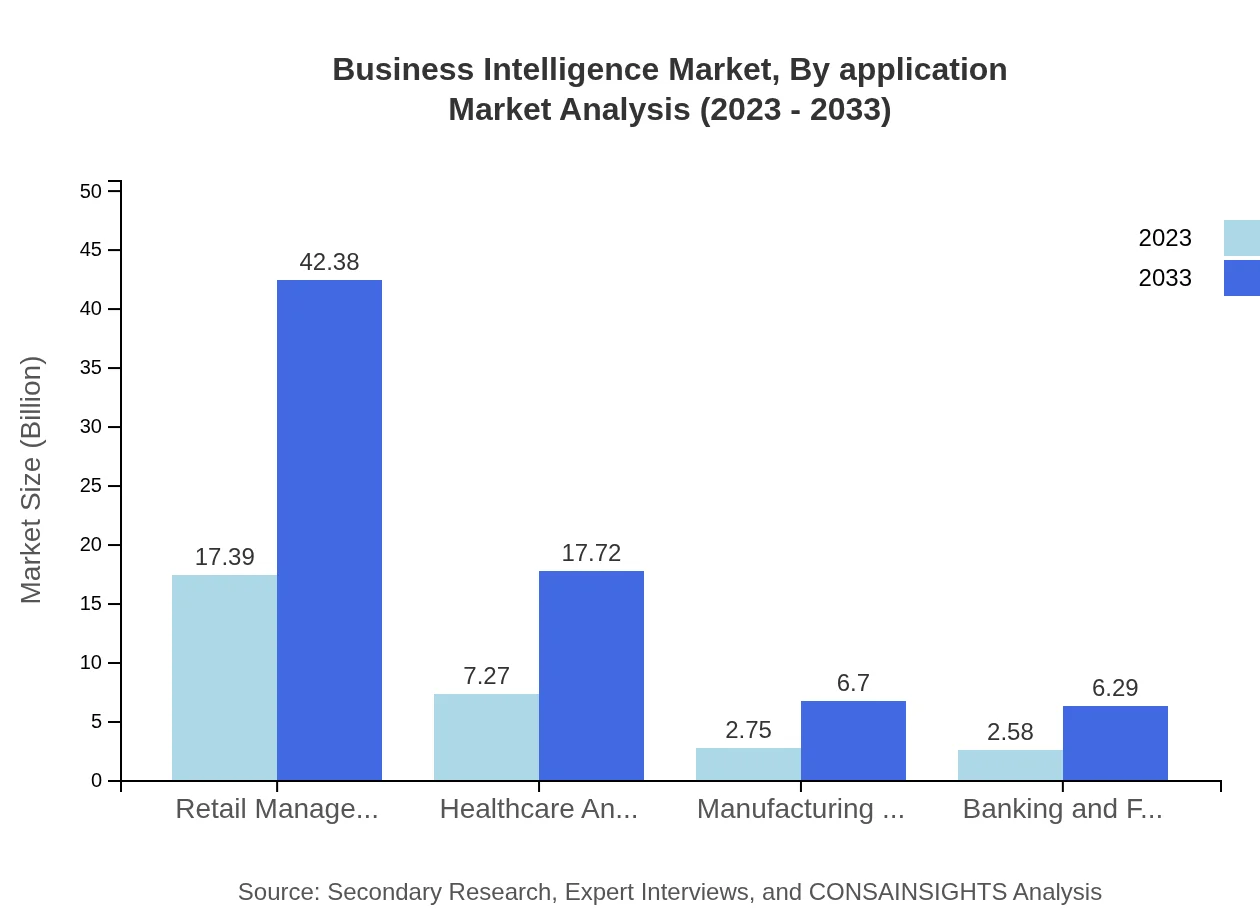
Application-wise, the retail sector is the largest market for BI solutions, projected to grow from $17.39 billion in 2023 to $42.38 billion by 2033. Healthcare follows, expanding from $7.27 billion to $17.72 billion, emphasizing the increased utilization of data analytics for patient care and operational improvement. The manufacturing and BFSI sectors, while holding smaller market shares, also showcase growth from $2.75 billion and $2.58 billion respectively, indicating a comprehensive application of BI tools across industries.
Business Intelligence Market Analysis By Deployment Mode

Regarding deployment, on-premises solutions dominate, growing from $24.45 billion in 2023 to $59.59 billion by 2033. This growth is driven largely by enterprise preferences for data security and accessibility. Cloud-based solutions are also gaining traction, estimated to reach $13.52 billion in 2033, showcasing a shift toward flexibility and cost-effectiveness.
Business Intelligence Market Analysis By User Type
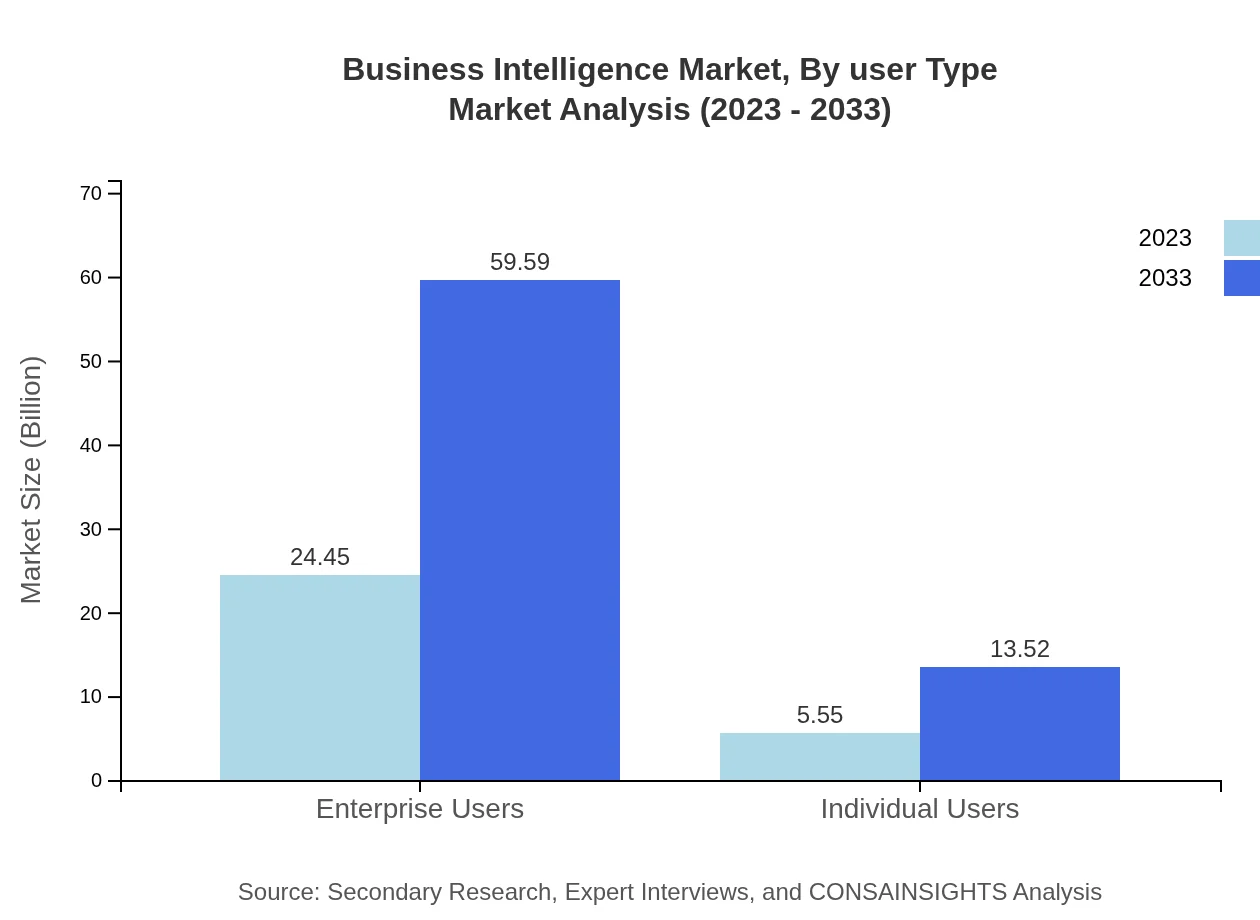
In terms of user type, enterprise users lead the market significantly, anticipated to grow from $24.45 billion in 2023 to $59.59 billion by 2033. The saturation of BI tools among individual users, estimated to increase from $5.55 billion to $13.52 billion, signals a growing focus on self-service analytics.
Business Intelligence Market Analysis By Industry

Industrially, sectors like retail and healthcare dominate the BI market, reflecting investments in analytics to drive business strategies. The retail market alone is projected to command 57.98% market share in 2023, which remains consistent over the forecast period. The BFSI sector, holding an 8.61% share, also shows promise, emphasizing the essential role of BI in risk analysis and financial insights.
Business Intelligence Market Trends and Future Forecast
Tell us your focus area and get a customized research report.
Global Market Leaders and Top Companies in Business Intelligence Industry
Microsoft:
Microsoft is a leading provider of BI solutions through its Microsoft Power BI platform, offering comprehensive analytics and data visualization capabilities tailored for businesses of all sizes.IBM:
IBM delivers advanced BI solutions via its Cognos Analytics platform, empowering enterprises with in-depth insights and predictive analytics functionalities that drive strategic decision-making.Tableau:
Tableau is renowned for its intuitive BI interface and data visualization tools, enabling users to create compelling visual narratives from complex datasets with ease.SAP:
SAP provides a suite of BI solutions designed for enterprise resource planning and analytics, helping organizations optimize operations and innovate using real-time data.We're grateful to work with incredible clients.


FAQs
What is the market size of business Intelligence?
The business intelligence market is valued at approximately $30 billion in 2023, with robust growth expected, reaching around $66 billion by 2033. The sector is projected to grow at a compound annual growth rate (CAGR) of 9% over the next decade.
What are the key market players or companies in this business Intelligence industry?
Key players in the business intelligence industry include tech giants such as Microsoft, SAP, IBM, and Oracle. These companies dominate the market with advanced analytics tools and comprehensive service offerings, significantly impacting industry growth.
What are the primary factors driving the growth in the business Intelligence industry?
The growth of the business intelligence market is primarily driven by the increasing amount of data generated, the need for real-time analytics, and businesses' desire to enhance decision-making processes through data insights and competitive advantages.
Which region is the fastest Growing in the business Intelligence?
The North American region is currently the fastest-growing sector in business intelligence, projected to grow from $10.15 billion in 2023 to $24.73 billion by 2033. Meanwhile, the Asia Pacific also shows promising growth, especially in digital transformation initiatives.
Does ConsaInsights provide customized market report data for the business Intelligence industry?
Yes, ConsaInsights offers tailored market report data for the business intelligence industry, enabling organizations to acquire insights specific to their needs, challenges, and market dynamics, ensuring more directed research outcomes.
What deliverables can I expect from this business Intelligence market research project?
Deliverables from a business intelligence market research project typically include comprehensive reports, market forecasts, competitor analyses, segment insights, and strategic recommendations, providing clients with a holistic view of market conditions.
What are the market trends of business Intelligence?
Current market trends in business intelligence include increased adoption of AI-driven analytics, a shift towards cloud-based solutions, and an emphasis on self-service BI capabilities, thus democratizing data access across organizational levels.