Reports >
Financial Services
>
E Brokerages Market Report

E Brokerages Market Report
First published: 04 October 2024 | Last updated: 24 January 2026 | Report Code: e-brokerages
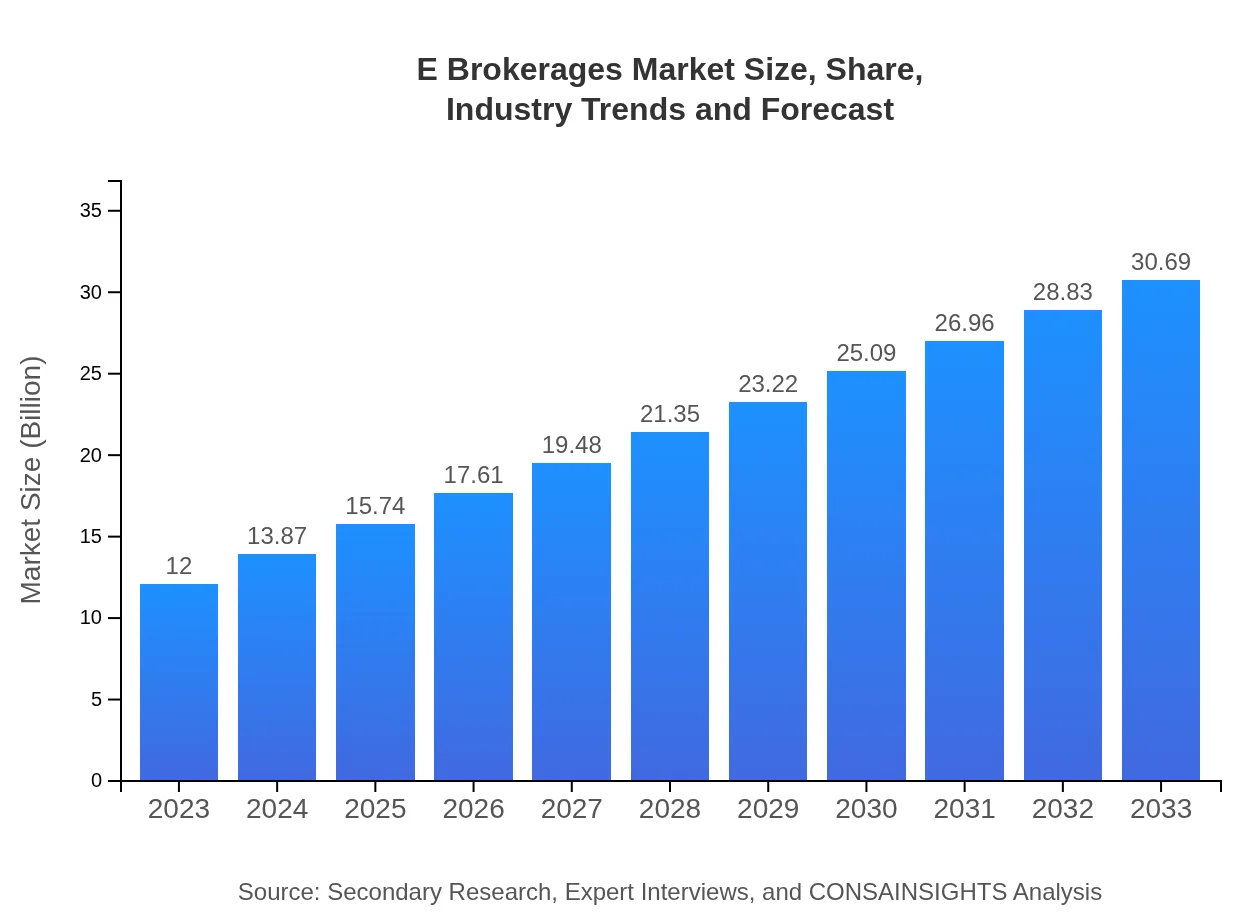
E Brokerages Market — USD $12 Billion in 2023, Growing to USD 30.69B by 2033 at 9.5% CAGR
This report provides an in-depth analysis of the E Brokerages market from 2023 to 2033, including market size, segmentation, regional insights, and emerging trends. Key data points and forecasts are presented to aid stakeholders in understanding market dynamics.
| Metric | Value |
|---|---|
| Study Period | 2023 - 2033 |
| 2023 Market Size | $12.00 Billion |
| CAGR (2023-2033) | 9.5% |
| 2033 Market Size | $30.69 Billion |
| Top Companies | Charles Schwab Corporation, Robinhood Markets, Inc., Interactive Brokers Group, Inc., E*TRADE Financial Corporation, Fidelity Investments |
| Published Date | 04 October 2024 |
| Last Modified Date | 24 January 2026 |
E Brokerages Market Overview
Customize E Brokerages Market Report market research report
- ✔ Get in-depth analysis of E Brokerages market size, growth, and forecasts.
- ✔ Understand E Brokerages's regional dynamics and industry-specific trends.
- ✔ Identify potential applications, end-user demand, and growth segments in E Brokerages
What is the Market Size & CAGR of E Brokerages market in 2023?
E Brokerages Industry Analysis
E Brokerages Market Segmentation and Scope
Tell us your focus area and get a customized research report.
E Brokerages Market Analysis Report by Region
Europe E Brokerages Market Report:
The European E Brokerages market is projected to reach $8.92 billion by 2033 from $3.49 billion in 2023. European brokerages benefit from a robust regulatory framework that assures investors' security and investor confidence. Moreover, a growing trend of digital trading, alongside an increase in remote work, has encouraged more participation from retail investors, enhancing overall market growth.Asia Pacific E Brokerages Market Report:
The Asia Pacific region is experiencing substantial growth, with the market expected to expand from $2.50 billion in 2023 to $6.40 billion by 2033. Factors such as increasing internet penetration, mobile technology adoption, and a growing middle-class population positively influence market growth. The region is also seeing rising demand for fintech solutions, contributing to the proliferation of online trading platforms that cater to varying investor needs.North America E Brokerages Market Report:
The North American E Brokerages market holds a significant share, forecasted to grow from $4.05 billion in 2023 to $10.35 billion by 2033. As the leading region in technology and innovation, the U.S. and Canada exhibit high adoption rates of online trading solutions. Competitive pricing models and the presence of major global players enhance market dynamics in this region, attracting both retail and institutional investors.South America E Brokerages Market Report:
In South America, the E Brokerages market is expected to grow from $0.86 billion in 2023 to $2.20 billion by 2033. Countries like Brazil and Argentina are leading the charge, with regulatory improvements and technological adoption fostering an environment conducive to increased trading activities. The rise of mobile platforms and greater financial literacy among the population is further expected to bolster market demand.Middle East & Africa E Brokerages Market Report:
In the Middle East and Africa, the E Brokerages market is anticipated to expand from $1.10 billion in 2023 to $2.81 billion by 2033. Growth in this region is driven by rising disposable incomes, the proliferation of mobile devices, and increased financial participation. This expansion presents significant opportunities for technology-driven brokerages and fintech companies to cater to the emerging investor demographic.Tell us your focus area and get a customized research report.
E Brokerages Market Analysis By Type

The market by type prominently features Full-Service Brokerages, with a projected market size of $19.62 billion by 2033 compared to $7.67 billion in 2023, maintaining a 63.91% market share. Discount Brokerages are anticipated to expand from $3.06 billion in 2023 to $7.83 billion by 2033, holding a 25.5% market share. Robo-Advisors also show growth potential, forecasted to increase from $1.27 billion to $3.25 billion, maintaining a 10.59% market share.
E Brokerages Market Analysis By Service

Services include Trading Services, projected to dominate with a size increase from $7.67 billion to $19.62 billion by 2033, holding 63.91% market share. Research and Analysis services also increase significantly from $3.06 billion to $7.83 billion, maintaining a 25.5% market share. Customer Support services, growing from $1.27 billion to $3.25 billion, remain critical for customer retention and satisfaction.
E Brokerages Market Analysis By Client Type

Market segmentation by client type is crucial, with Institutional Investors commanding a share of 63.91%, increasing from $7.67 billion to $19.62 billion by 2033. Retail Investors, however, show significant growth potential as their size increases from $3.06 billion to $7.83 billion, while High-Net-Worth Individuals also experience an increase from $1.27 billion to $3.25 billion, each segment contributing to overall market expansion.
E Brokerages Market Analysis By Region

Regional analysis showcases significant growth across all areas. North America remains a leader; however, Asia Pacific is witnessing rapid adoption of online trading platforms due to technological advancements. Europe is capitalizing on regulatory frameworks to enhance confidence, while South America and the Middle East & Africa are opening new opportunities spurred by increased financial literacy.
E Brokerages Market Analysis By Compliance
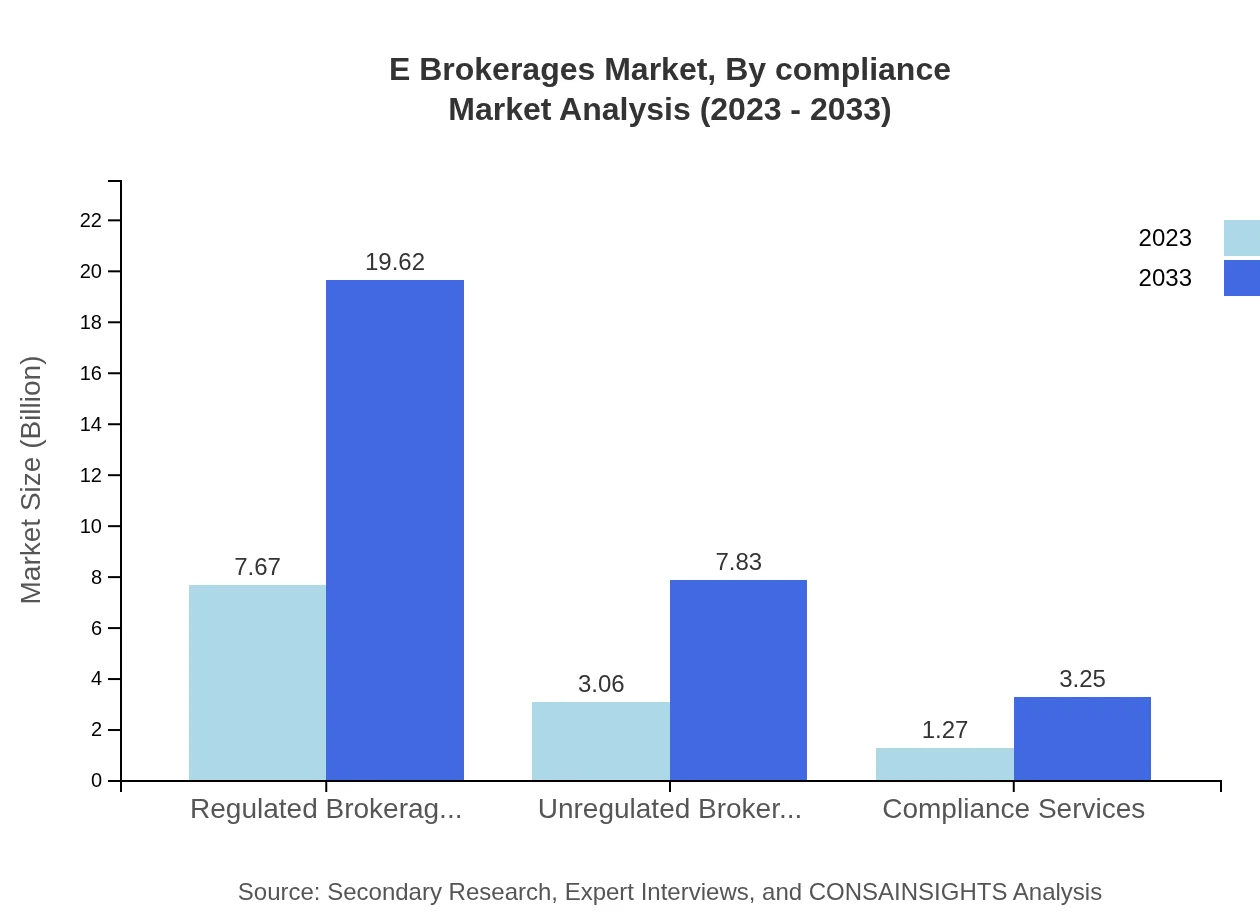
The E Brokerages market's compliance segment is paramount. Regulated Brokerages dominate the market, maintaining a 63.91% share from $7.67 billion to $19.62 billion by 2033. In contrast, Unregulated Brokerages are on a growth trajectory, expanding from $3.06 billion to $7.83 billion, despite regulatory challenges impacting their market positioning.
E Brokerages Market Trends and Future Forecast
Tell us your focus area and get a customized research report.
Global Market Leaders and Top Companies in E Brokerages Industry
Charles Schwab Corporation:
Charles Schwab offers a wide range of financial services, including brokerage services, and is a leader in the market due to its robust technology and customer service model.Robinhood Markets, Inc.:
Robinhood has become a market disruptor with its commission-free trading model, primarily targeting millennials and younger investors.Interactive Brokers Group, Inc.:
Interactive Brokers is known for its comprehensive platform and low-cost trading, appealing to both professional traders and casual investors.E*TRADE Financial Corporation:
E*TRADE is recognized for its user-friendly platform and extensive educational resources aimed at new investors.Fidelity Investments:
Fidelity is a major player in the financial services sector with a strong focus on investment services, including E Brokerage.We're grateful to work with incredible clients.


FAQs
What is the market size of e Brokerages?
The e-brokerages market is projected to reach $12 billion by 2033, growing at a CAGR of 9.5% from its current value. This growth is driven by increasing demand for online trading platforms and rising retail investor participation.
What are the key market players or companies in the e Brokerages industry?
Key players in the e-brokerages industry include large financial institutions and fintech companies such as Charles Schwab, E*TRADE, Robinhood, and Interactive Brokers, which are essential for competition, innovation, and offering diverse trading services.
What are the primary factors driving the growth in the e Brokerages industry?
Growth in the e-brokerages industry is driven by advancements in technology, the increasing uptake of mobile trading, regulatory changes favoring online trading, and a rise in self-directed investing among retail investors seeking affordable solutions.
Which region is the fastest Growing in the e Brokerages market?
The Asia Pacific region is the fastest-growing market for e-brokerages, expanding from $2.50 billion in 2023 to $6.40 billion by 2033, as more individuals gain access to financial markets and local economies grow.
Does ConsaInsights provide customized market report data for the e Brokerages industry?
Yes, ConsaInsights offers customized market report data tailored to specific needs within the e-brokerages industry, allowing businesses to gain insights into niche markets, competitive landscapes, and emerging trends.
What deliverables can I expect from this e Brokerages market research project?
Deliverables from the e-brokerages market research project will typically include comprehensive market analysis reports, insights on market trends, competitor landscapes, consumer behavior studies, and segmentation analysis to aid strategic decision-making.
What are the market trends of e Brokerages?
Current trends in the e-brokerages market include the rise of robo-advisors, increasing integration of AI and machine learning for personalized trading experiences, the popularity of mobile platforms, and the demand for low-cost trading solutions.