Reports >
Technology And Media
>
Fintech Blockchain Market Report

Fintech Blockchain Market Report
Published Date: 31 January 2026 | Report Code: fintech-blockchain
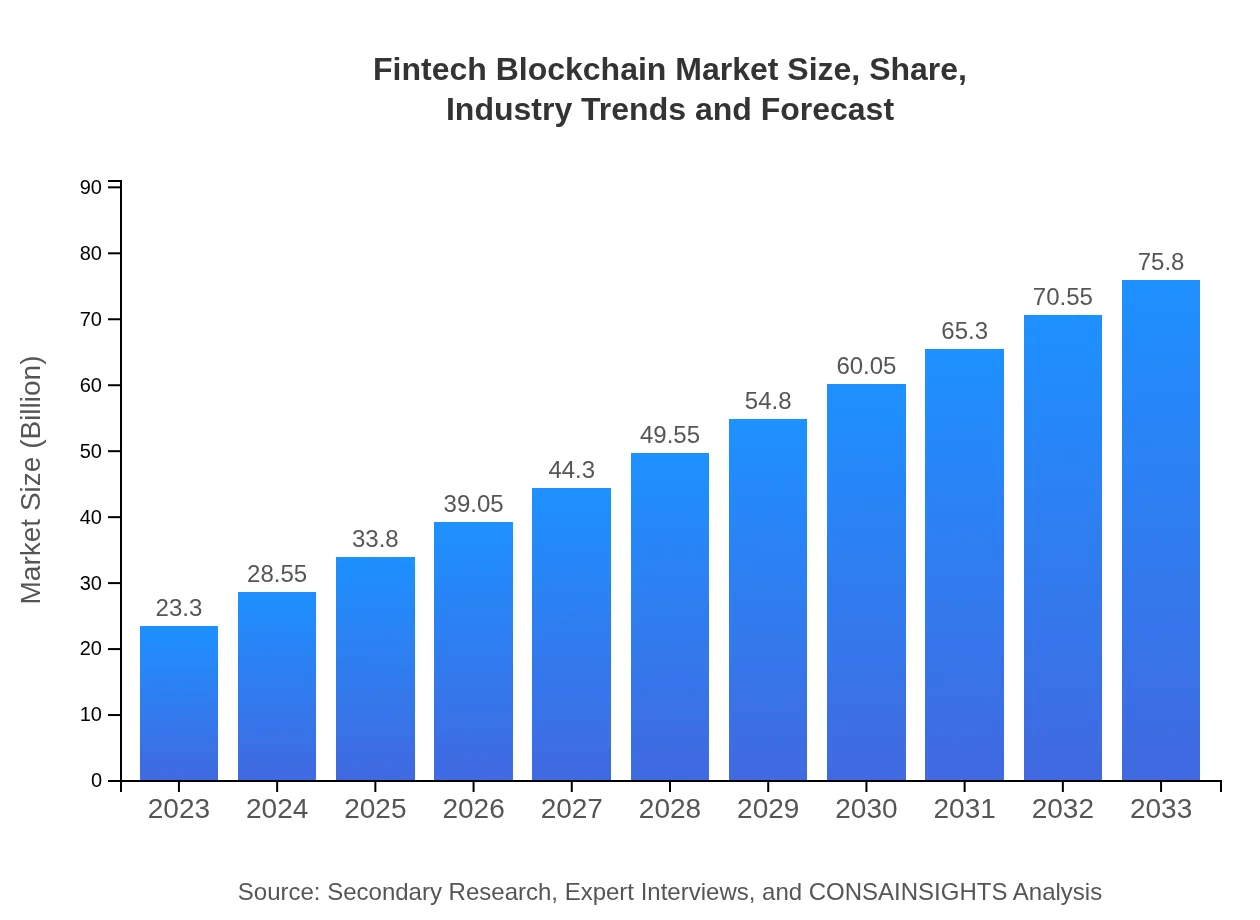
Fintech Blockchain Market Size, Share, Industry Trends and Forecast to 2033
This report provides detailed insights into the Fintech Blockchain market, analyzing current trends, market segmentation, and regional performance from 2023 to 2033, along with a comprehensive overview of market size and growth forecasts.
| Metric | Value |
|---|---|
| Study Period | 2023 - 2033 |
| 2023 Market Size | $23.30 Billion |
| CAGR (2023-2033) | 12% |
| 2033 Market Size | $75.80 Billion |
| Top Companies | IBM, Ripple Labs, Chainalysis, Coinbase , Binance |
| Last Modified Date | 31 January 2026 |
Fintech Blockchain Market Overview
Customize Fintech Blockchain Market Report market research report
- ✔ Get in-depth analysis of Fintech Blockchain market size, growth, and forecasts.
- ✔ Understand Fintech Blockchain's regional dynamics and industry-specific trends.
- ✔ Identify potential applications, end-user demand, and growth segments in Fintech Blockchain
What is the Market Size & CAGR of Fintech Blockchain market in 2023?
Fintech Blockchain Industry Analysis
Fintech Blockchain Market Segmentation and Scope
Tell us your focus area and get a customized research report.
Fintech Blockchain Market Analysis Report by Region
Europe Fintech Blockchain Market Report:
In Europe, the market size will grow from $7.29 billion in 2023 to $23.71 billion in 2033, driven by the stringent regulatory environment encouraging fintech innovations and strategic partnerships between financial institutions and technology companies.Asia Pacific Fintech Blockchain Market Report:
In the Asia Pacific region, the market is projected to grow from $4.45 billion in 2023 to $14.47 billion by 2033. Countries like China and India are leading in blockchain adoption, primarily driven by advancements in technology and supportive regulations aimed at fostering innovation.North America Fintech Blockchain Market Report:
North America is leading the market, with a valuation expected to rise from $8.06 billion in 2023 to $26.23 billion by 2033. The region is home to numerous Fintech organizations and is characterized by high investment in blockchain for secure transactional environments.South America Fintech Blockchain Market Report:
The South American market is expected to increase from $1.73 billion in 2023 to $5.64 billion in 2033. The growth is stimulated by the increasing digitization of financial services and government initiatives promoting blockchain technology for various applications.Middle East & Africa Fintech Blockchain Market Report:
The Middle East and Africa market is anticipated to grow from $1.77 billion in 2023 to $5.75 billion by 2033, as governments and private sectors increasingly acknowledge the potential of blockchain technology to enhance transparency and streamline operations.Tell us your focus area and get a customized research report.
Fintech Blockchain Market Analysis By Product

The product segments contributing to the Fintech Blockchain market include Digital Wallets, Blockchain Platforms, and Blockchain Services. Digital Wallets, valued at $15.61 billion in 2023, dominate the market with a share of 67.01%. Blockchain Platforms and Services are also significant, supporting the infrastructure needed for innovations in financial transactions.
Fintech Blockchain Market Analysis By Application
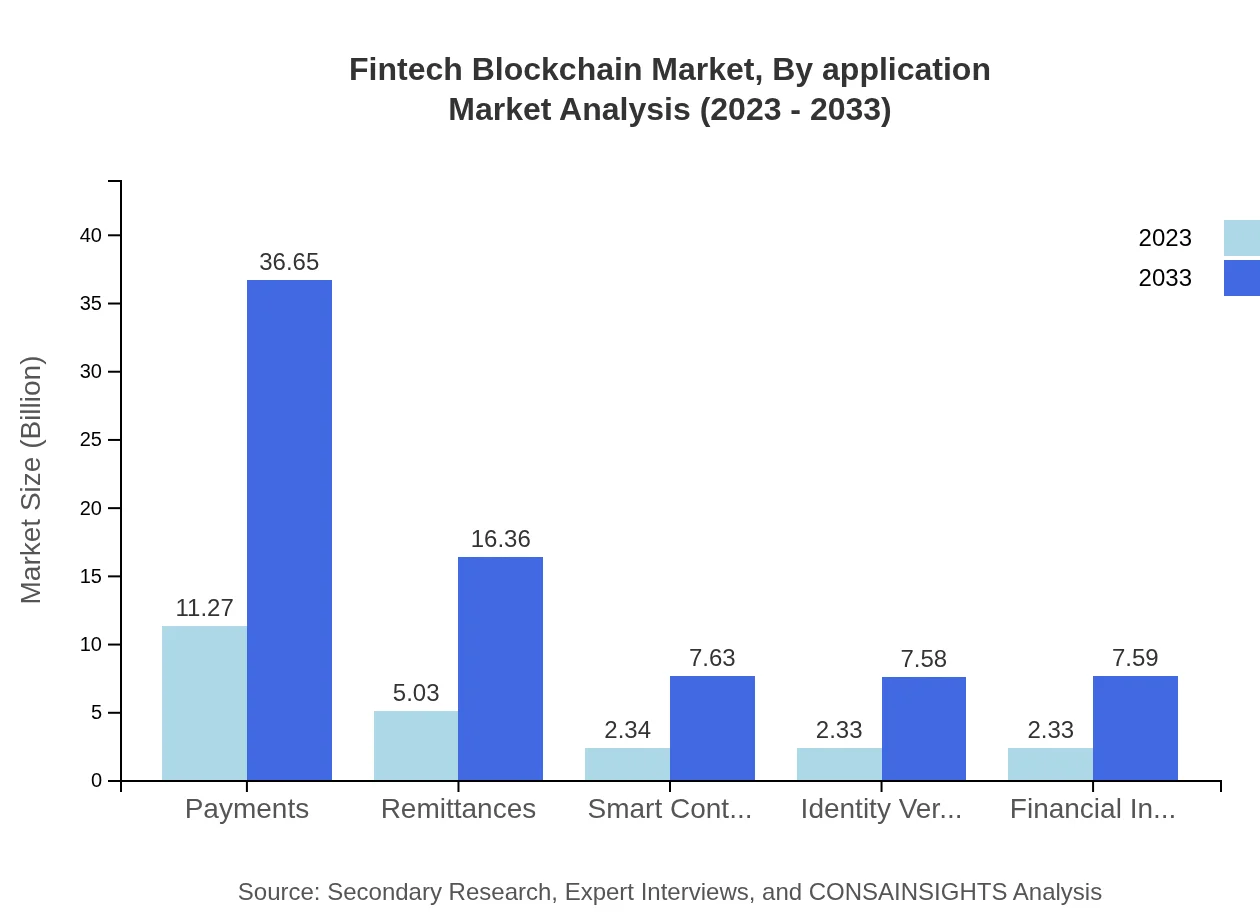
The applications of Fintech Blockchain technology cover areas such as Payments, Remittances, Identity Verification, and Smart Contracts. Payments represent a substantial portion of the market, with projections showing an increase from $11.27 billion in 2023 to $36.65 billion by 2033, holding a share of 48.35%.
Fintech Blockchain Market Analysis By End User

End-users of Fintech Blockchain technology include Financial Institutions, Investment Firms, Insurance companies, and Remittance Companies. Banking applications dominate, expecting growth from $11.27 billion in 2023 to $36.65 billion by 2033, highlighting the critical role of banks in implementing blockchain solutions.
Fintech Blockchain Market Analysis By Technology

Technological advancements such as Public Blockchain, Private Blockchain, and Consortium Blockchain are essential in the Fintech sector. Public Blockchain currently dominates with a projected revenue increase from $15.61 billion in 2023 to $50.79 billion by 2033, reflecting its foundational role in the industry.
Fintech Blockchain Market Analysis By Regulatory Framework
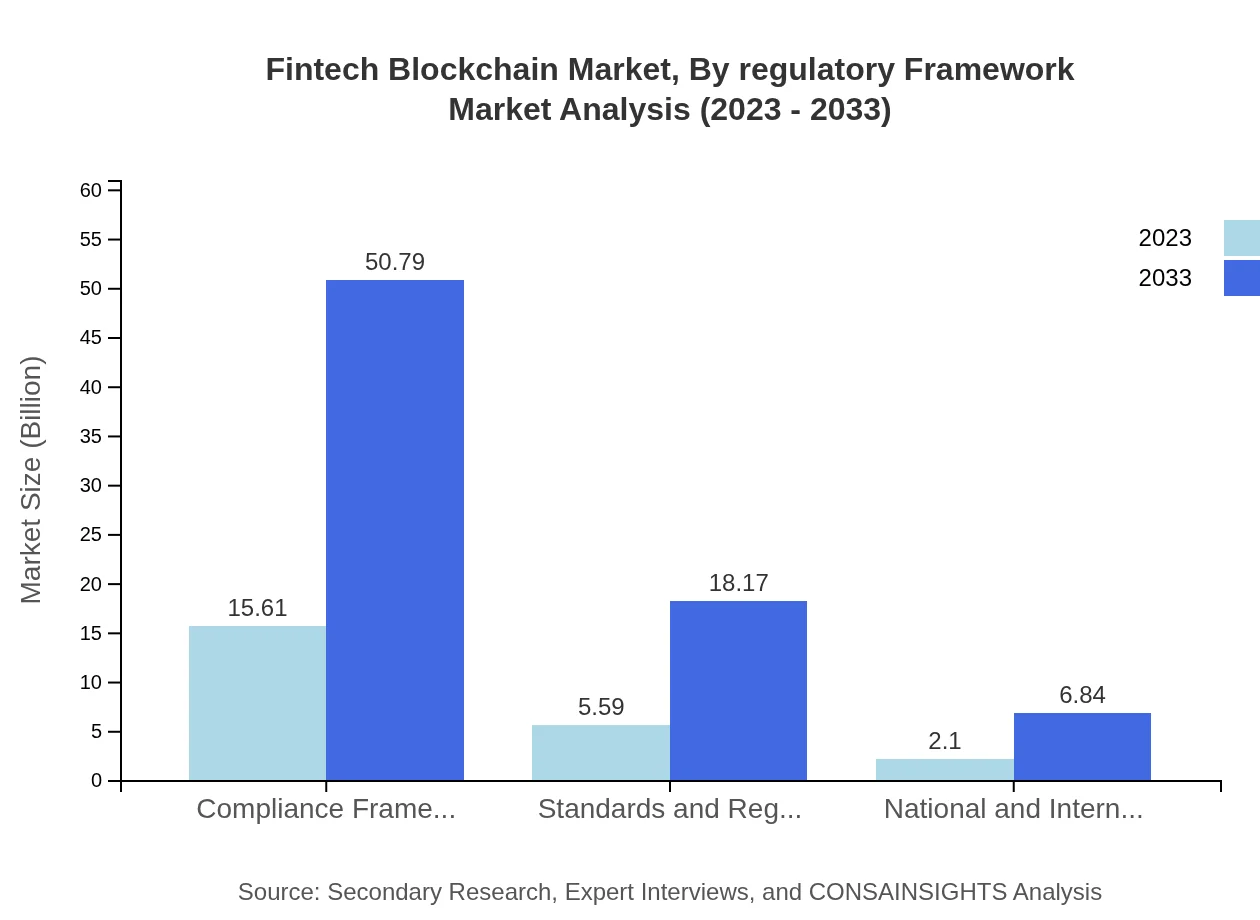
Regulatory frameworks significantly influence the adoption and implementation of blockchain in finance. Compliance frameworks, standards, and regulations are evolving to accommodate the growth of blockchain technology, with the market for Compliance Frameworks expected to grow from $15.61 billion in 2023 to $50.79 billion by 2033.
Fintech Blockchain Market Trends and Future Forecast
Tell us your focus area and get a customized research report.
Global Market Leaders and Top Companies in Fintech Blockchain Industry
IBM:
A leader in blockchain technology providing enterprise solutions across various sectors, including finance, supply chain, and healthcare.Ripple Labs:
Known for its digital payment protocol and cryptocurrency, Ripple is facilitating real-time global payments using blockchain technology.Chainalysis:
A key player in cryptocurrency compliance and investigation, providing solutions for institutions to ensure regulatory compliance.Coinbase :
A leading cryptocurrency exchange that enables users to trade a range of cryptocurrencies, leveraging blockchain technology for secure transactions.Binance:
One of the largest cryptocurrency exchanges globally, offering trading, investment, and blockchain-based services to millions of users.We're grateful to work with incredible clients.


FAQs
What is the market size of fintech Blockchain?
The fintech-blockchain market is valued at approximately $23.3 billion in 2023, with a projected CAGR of 12% through 2033, indicating significant growth potential in the coming years.
What are the key market players or companies in the fintech Blockchain industry?
Key players in the fintech-blockchain industry include major tech corporations, financial institutions, and blockchain startups focusing on enhancing transaction security and efficiency.
What are the primary factors driving the growth in the fintech Blockchain industry?
Growth drivers include increasing demand for secure payment systems, the rising adoption of cryptocurrencies, improved transparency in transactions, regulatory support, and the necessity for efficient financial services.
Which region is the fastest Growing in the fintech Blockchain?
North America is the fastest-growing region, projected to expand from $8.06 billion in 2023 to $26.23 billion by 2033, highlighting strong investment and innovation in fintech solutions.
Does ConsaInsights provide customized market report data for the fintech Blockchain industry?
Yes, ConsaInsights offers customized market reports tailored to specific needs, providing comprehensive insights into trends, challenges, and opportunities across the fintech-blockchain industry.
What deliverables can I expect from this fintech Blockchain market research project?
Deliverables include detailed market analysis reports, regional assessments, competitor benchmarking, segment breakdowns, and actionable insights based on the latest industry trends and data.
What are the market trends of fintech Blockchain?
Trends include the growing use of digital wallets, the rise of blockchain platforms and services, increased focus on regulatory compliance, and the integration of smart contracts and identity verification technologies.