Graph Database Market Report
Published Date: 31 January 2026 | Report Code: graph-database
Graph Database Market Size, Share, Industry Trends and Forecast to 2033
This report examines the Graph Database market, providing insights into market trends, region-specific analyses, and projections from 2023 to 2033. It covers market size, CAGR, and significant technological advancements affecting industry growth.
| Metric | Value |
|---|---|
| Study Period | 2023 - 2033 |
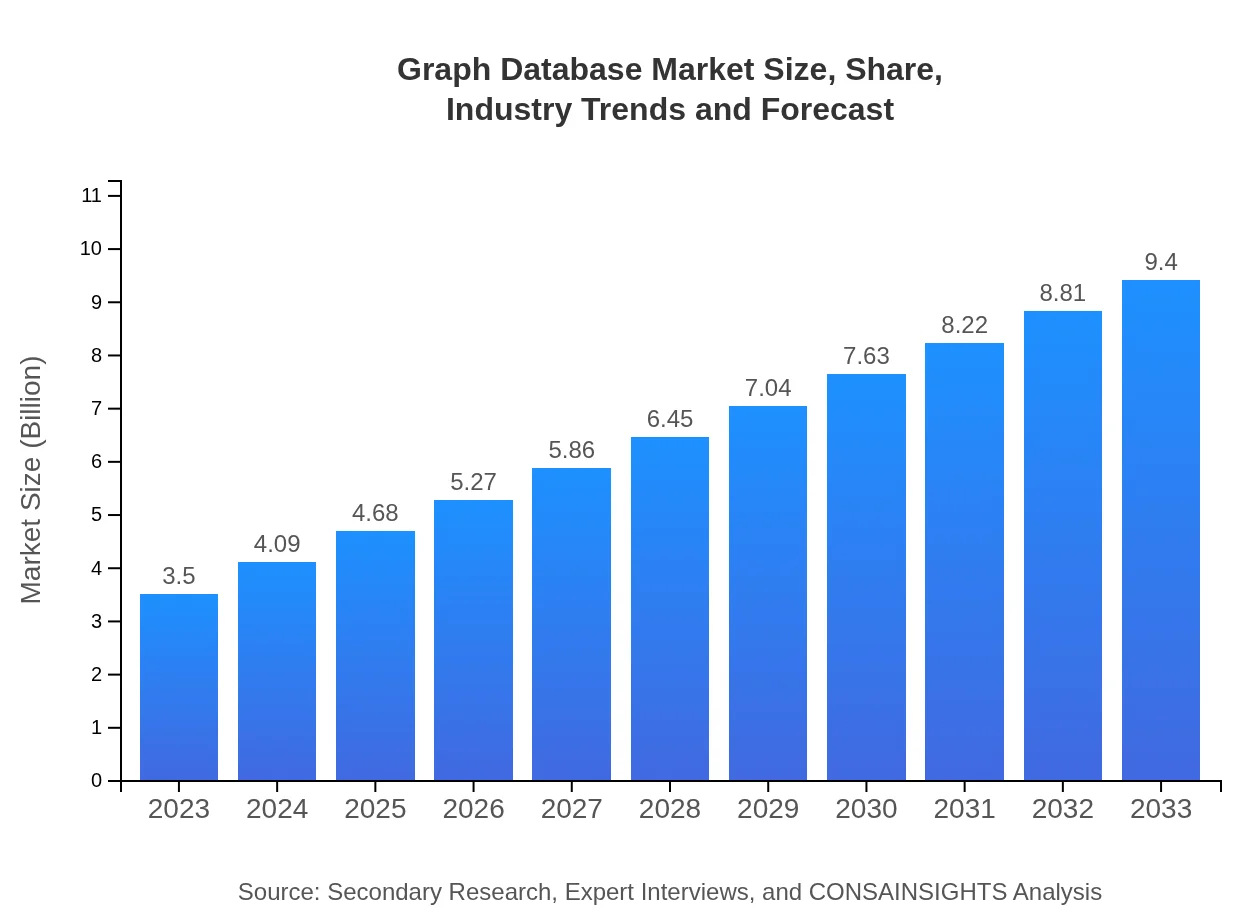
| 2023 Market Size | $3.50 Billion |
| CAGR (2023-2033) | 10% |
| 2033 Market Size | $9.40 Billion |
| Top Companies | Neo4j, Amazon Web Services (AWS), Microsoft, MongoDB, TigerGraph |
| Last Modified Date | 31 January 2026 |
Graph Database Market Overview
Customize Graph Database Market Report market research report
- ✔ Get in-depth analysis of Graph Database market size, growth, and forecasts.
- ✔ Understand Graph Database's regional dynamics and industry-specific trends.
- ✔ Identify potential applications, end-user demand, and growth segments in Graph Database
What is the Market Size & CAGR of Graph Database market in 2023?
Graph Database Industry Analysis
Graph Database Market Segmentation and Scope
Tell us your focus area and get a customized research report.
Graph Database Market Analysis Report by Region
Europe Graph Database Market Report:
In Europe, the market size for Graph Databases is expected to grow from $1.11 billion in 2023 to $2.99 billion by 2033, reflecting a strong CAGR of 10.31%. The increasing focus on data privacy and compliance is prompting organizations to adopt advanced graph database solutions.Asia Pacific Graph Database Market Report:
In 2023, the Graph Database market in the Asia-Pacific region is valued at $0.69 billion and is projected to reach approximately $1.87 billion by 2033, growing at a robust CAGR of 10.45%. The increasing adoption of advanced technologies and data-driven strategies in countries like China and India drives this growth.North America Graph Database Market Report:
North America represents one of the largest markets for Graph Databases, with a valuation of $1.15 billion in 2023. By 2033, it is projected to reach $3.10 billion, achieving a CAGR of 10.15%. The presence of major technology companies and investment in data infrastructure are key growth factors.South America Graph Database Market Report:
The Graph Database market in South America is valued at $0.32 billion in 2023, with expectations to grow to $0.87 billion by 2033, translating to a CAGR of 10.14%. The rising demand for data analytics in various sectors is fueling market development in this region.Middle East & Africa Graph Database Market Report:
The Middle East and Africa will see the Graph Database market grow from $0.21 billion in 2023 to $0.57 billion by 2033, marking a CAGR of 10.36%. This growth is supported by digital transformation initiatives and increasing investments in technology.Tell us your focus area and get a customized research report.
Graph Database Market Analysis By Product
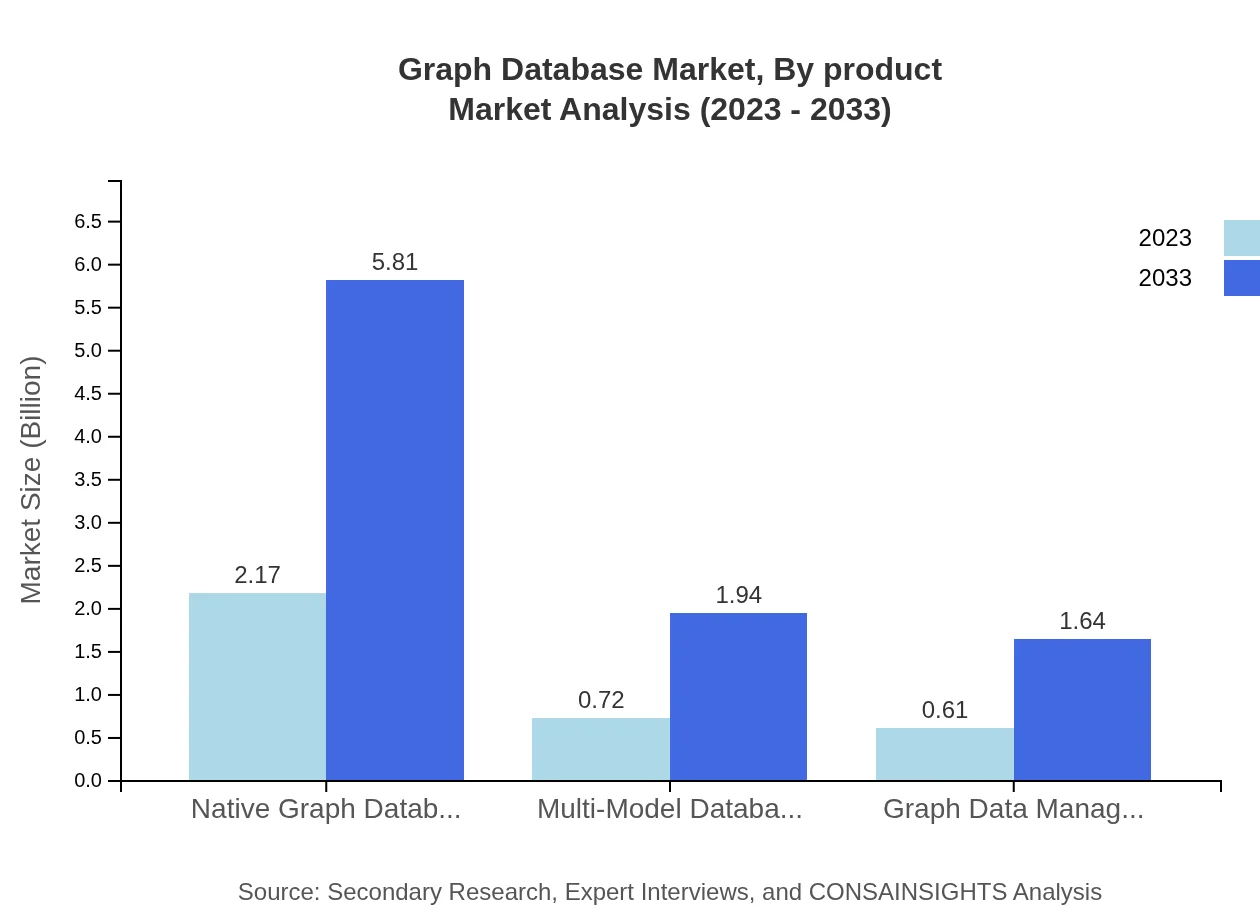
Native Graph Databases account for a substantial portion of the market, valued at $2.17 billion in 2023, projected to grow to $5.81 billion by 2033, maintaining a market share of 61.86%. Multi-Model Databases and Graph Data Management Software cater to niche segments with growth from $0.72 billion to $1.94 billion and $0.61 billion to $1.64 billion respectively.
Graph Database Market Analysis By Application
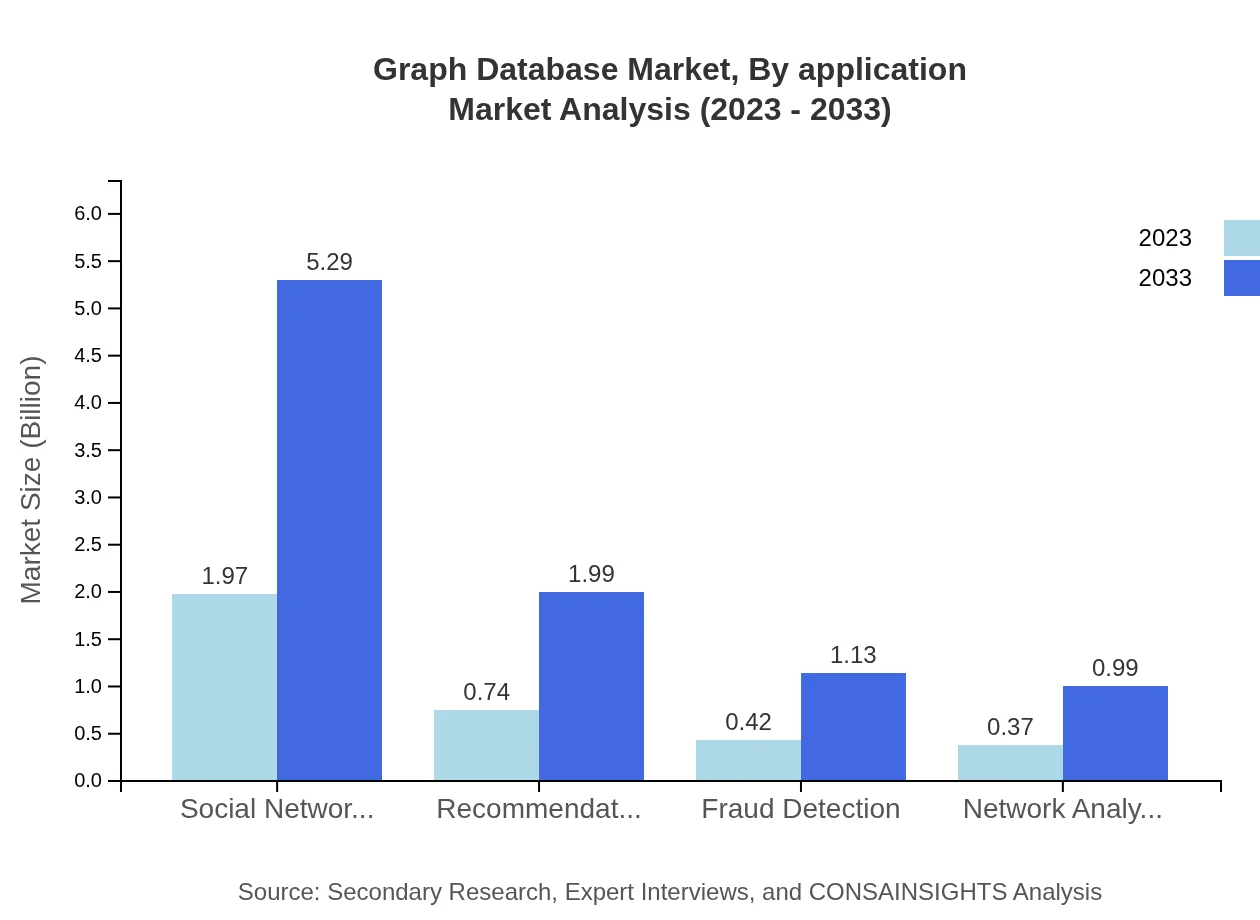
In the application segment, Social Networking holds the largest market share at 56.29%, valued at $1.97 billion in 2023, anticipated to grow to $5.29 billion by 2033. Other significant applications include Recommendation Engines and Fraud Detection, with market sizes expanding from $0.74 billion to $1.99 billion and $0.42 billion to $1.13 billion respectively.
Graph Database Market Analysis By Deployment Type
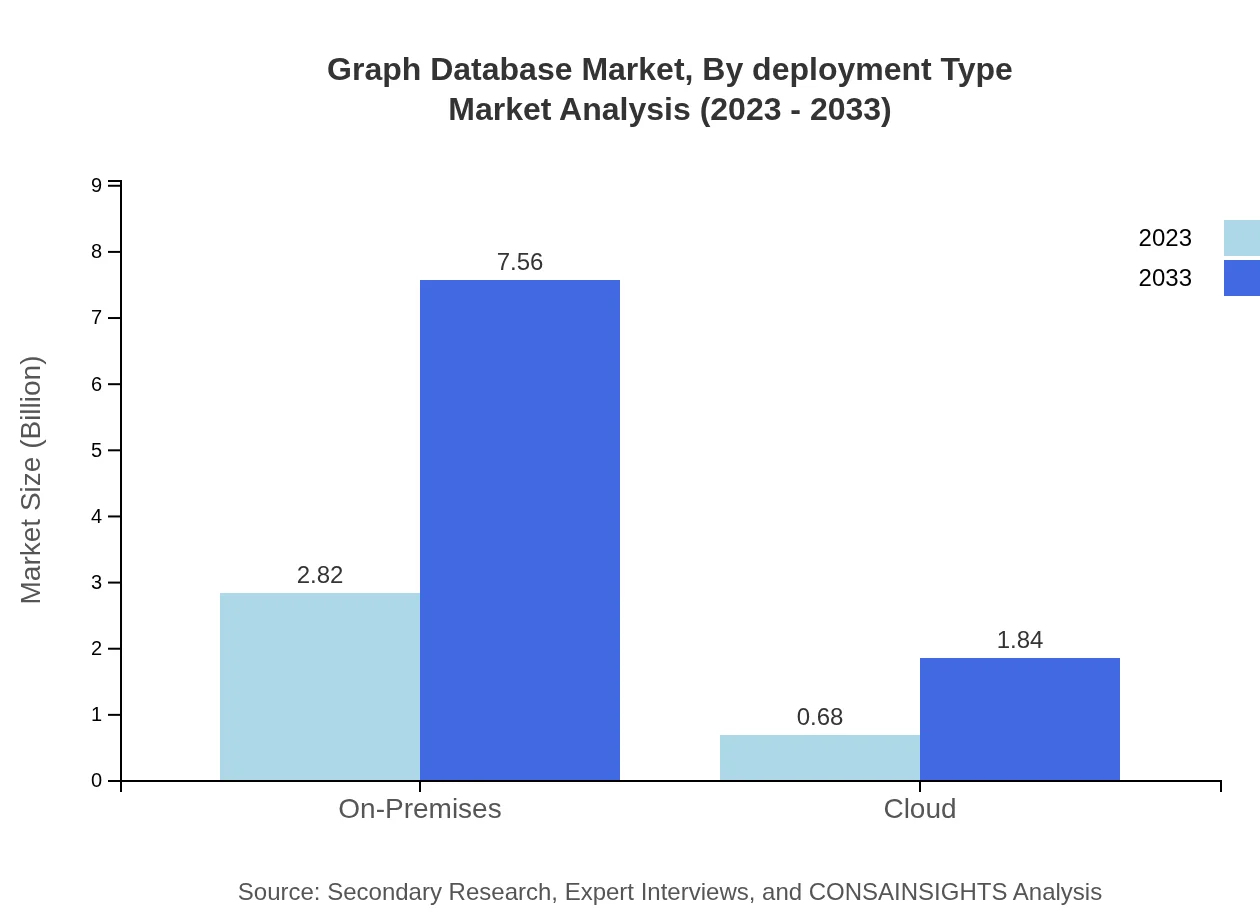
On-Premises solutions dominate the deployment segment, with a market size of $2.82 billion in 2023, projected to grow to $7.56 billion by 2033, maintaining an 80.44% market share. Meanwhile, Cloud deployments are growing, expected to reach $1.84 billion by 2033.
Graph Database Market Analysis By Industry Vertical
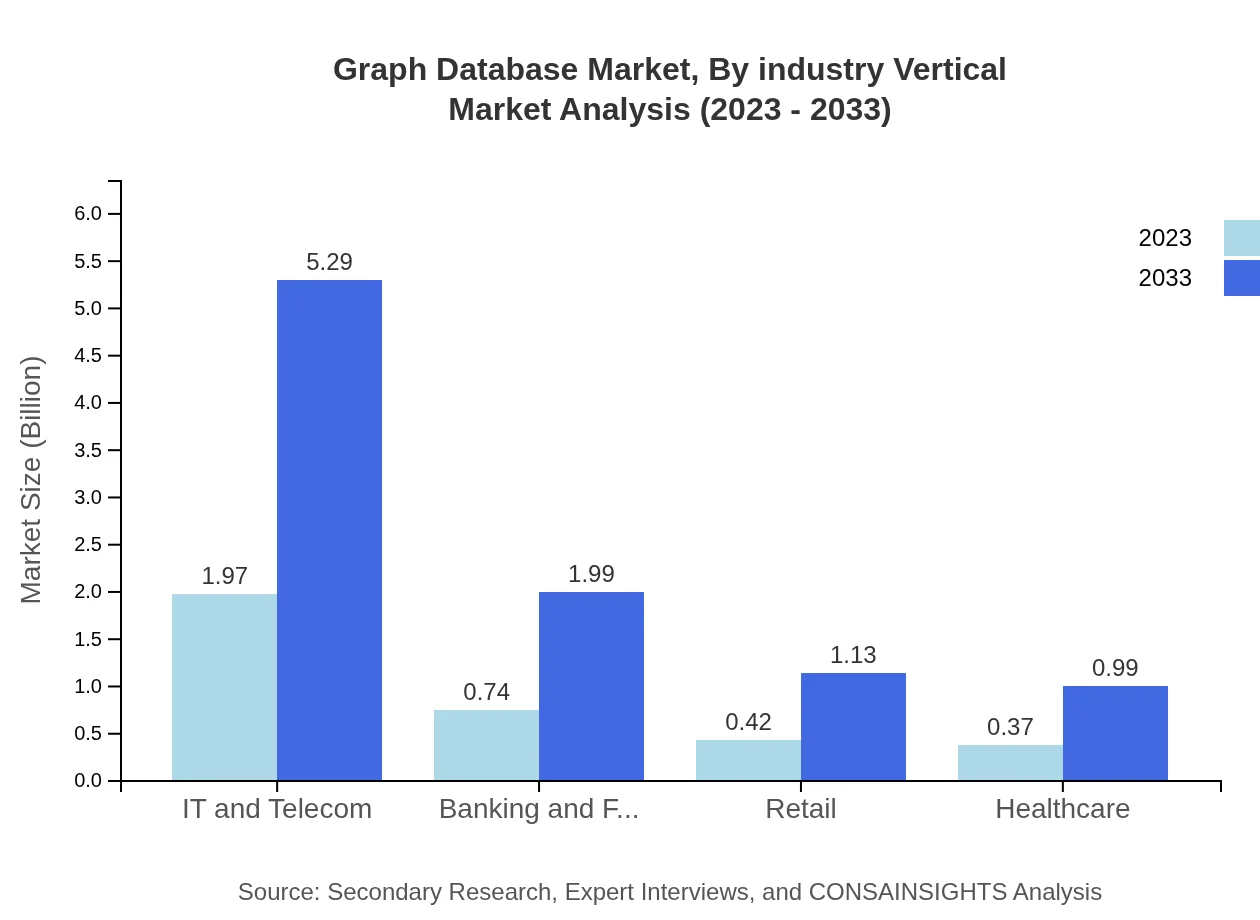
The key industries adopting Graph Databases include IT and Telecom, which holds 56.29% of the market share, followed closely by Banking and Financial Services and Retail, projected for significant growth from $0.74 billion to $1.99 billion and $0.42 billion to $1.13 billion respectively.
Graph Database Market Analysis By End User
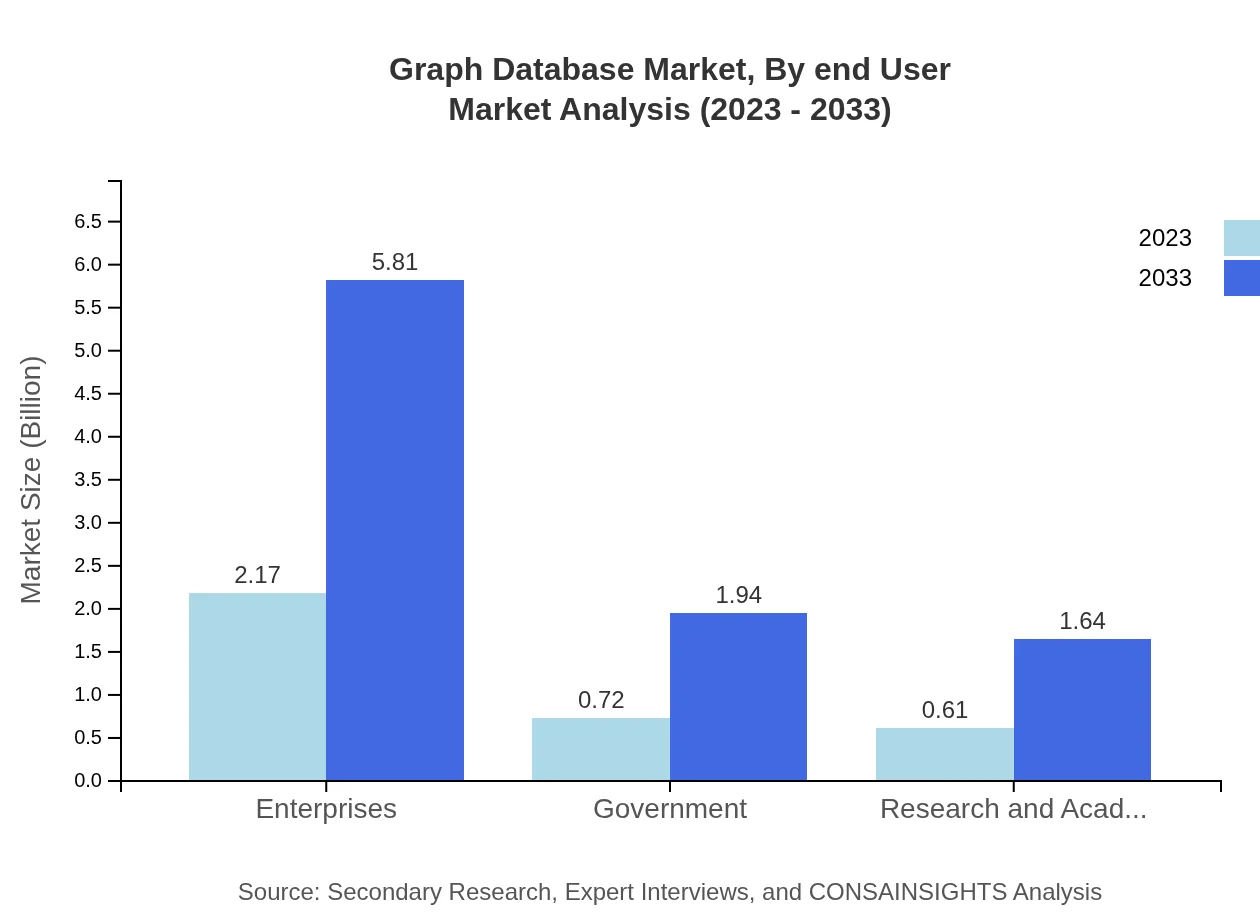
Enterprise use of Graph Databases is substantial, with a market share of 61.86%. The applications in Government and Research also show promising growth, with market valuations of $0.72 billion and $0.61 billion respectively, expanding as organizations embrace these technologies.
Graph Database Market Trends and Future Forecast
Tell us your focus area and get a customized research report.
Global Market Leaders and Top Companies in Graph Database Industry
Neo4j:
Neo4j is a leading provider of graph database management systems, focusing on native graph technology to help businesses build intelligent data solutions.Amazon Web Services (AWS):
AWS offers a robust managed graph database service called Amazon Neptune, enabling users to build applications that work with connected data.Microsoft:
Microsoft's Azure Cosmos DB includes support for graph database workloads, providing globally distributed and scalable solutions.MongoDB:
MongoDB, known for its versatile NoSQL database, also supports graph processing capabilities that cater to varied application needs.TigerGraph:
TigerGraph is noted for its high-performance graph database built to provide real-time analytics across massive datasets.We're grateful to work with incredible clients.







FAQs
What is the market size of graph Database?
The global Graph Database market is projected to reach approximately $3.5 billion by 2033, growing at a CAGR of 10% from its current valuation. This growth indicates a strong demand for advanced data management solutions.
What are the key market players or companies in this graph Database industry?
Key players in the Graph Database industry include Neo4j, Amazon Web Services, Microsoft, and Oracle, among others. These companies are leading innovations and advancing the technology to cater to various market needs.
What are the primary factors driving the growth in the graph Database industry?
The growth in the graph-database industry is fueled by the increasing volume of data, demand for real-time analytics, and the need for efficient data connections. Furthermore, the rise of Artificial Intelligence applications contributes significantly.
Which region is the fastest Growing in the graph Database?
The North America region is the fastest-growing segment in the Graph Database market, expected to increase from $1.15 billion in 2023 to approximately $3.10 billion by 2033, showcasing a thriving tech ecosystem.
Does ConsaInsights provide customized market report data for the graph Database industry?
Yes, ConsaInsights offers customized market report data tailored to specific needs within the graph-database industry. These tailored reports provide deep insights and analytics as per client specifications.
What deliverables can I expect from this graph Database market research project?
From the graph-database market research project, you can expect detailed insights in the form of comprehensive reports, market forecasts, segment analysis, competitive landscape, and custom data visualizations.
What are the market trends of graph Database?
Significant trends in the graph-database market include the rise of native graph databases, cloud-based solutions, and the integration of advanced analytics, indicating a shift towards more interconnected and dynamic data management systems.

