
Healthcare Business Intelligence Market Report
Published Date: 31 January 2026 | Report Code: healthcare-business-intelligence
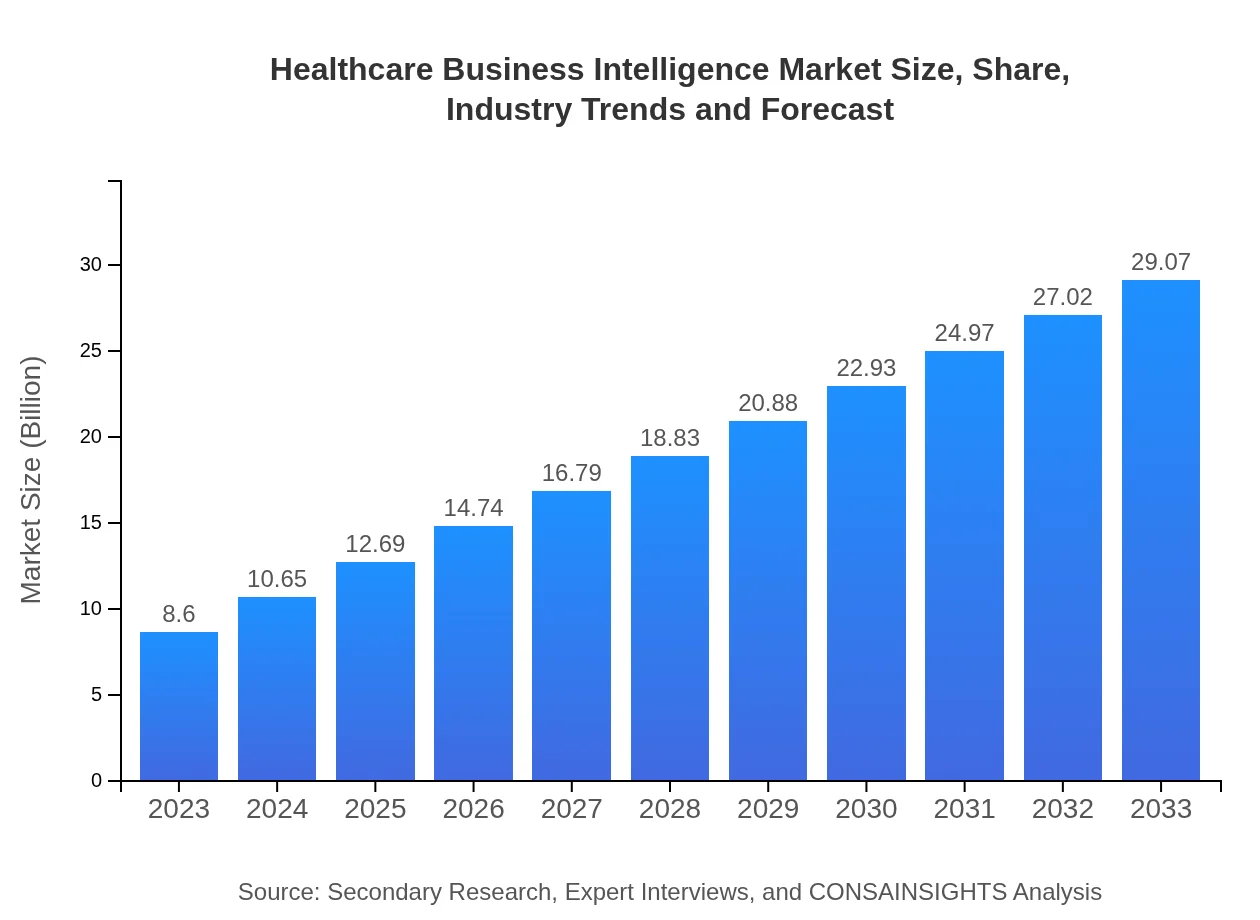
Healthcare Business Intelligence Market Size, Share, Industry Trends and Forecast to 2033
This report delivers an in-depth analysis of the Healthcare Business Intelligence market from 2023 to 2033, highlighting key trends, growth opportunities, and forecasts tailored for stakeholders seeking strategic insights. It encompasses market size, segmentation, regional analysis, leading players, and technological advancements.
| Metric | Value |
|---|---|
| Study Period | 2023 - 2033 |
| 2023 Market Size | $8.60 Billion |
| CAGR (2023-2033) | 12.4% |
| 2033 Market Size | $29.07 Billion |
| Top Companies | IBM Watson Health, Tableau Software, SAP SE, Oracle Corporation, Microsoft |
| Last Modified Date | 31 January 2026 |
Healthcare Business Intelligence Market Overview
Customize Healthcare Business Intelligence Market Report market research report
- ✔ Get in-depth analysis of Healthcare Business Intelligence market size, growth, and forecasts.
- ✔ Understand Healthcare Business Intelligence's regional dynamics and industry-specific trends.
- ✔ Identify potential applications, end-user demand, and growth segments in Healthcare Business Intelligence
What is the Market Size & CAGR of Healthcare Business Intelligence market in 2023?
Healthcare Business Intelligence Industry Analysis
Healthcare Business Intelligence Market Segmentation and Scope
Tell us your focus area and get a customized research report.
Healthcare Business Intelligence Market Analysis Report by Region
Europe Healthcare Business Intelligence Market Report:
In Europe, the market is expected to rise from $2.41 billion in 2023 to $8.16 billion in 2033. The growth is largely supported by robust healthcare policies aimed at enhancing patient outcomes through data-driven insights.Asia Pacific Healthcare Business Intelligence Market Report:
In the Asia Pacific region, the Healthcare Business Intelligence market is projected to expand from $1.65 billion in 2023 to $5.56 billion in 2033. This growth can be attributed to rising healthcare expenditures, increasing adoption of advanced analytics, and government initiatives promoting digital health solutions.North America Healthcare Business Intelligence Market Report:
North America holds the largest share of the market, poised to grow from $2.76 billion in 2023 to $9.34 billion in 2033. The region benefits from advanced healthcare infrastructure, high adoption rates of BI tools, and stringent regulatory mandates for data reporting and analysis.South America Healthcare Business Intelligence Market Report:
The South American market, while smaller, is set to grow from $0.59 billion in 2023 to $1.99 billion in 2033. The growth is driven by the emerging trend of health system modernization and increasing investments in health IT infrastructure.Middle East & Africa Healthcare Business Intelligence Market Report:
The Middle East and Africa region shows promising growth from $1.19 billion in 2023 to $4.01 billion in 2033 as countries invest in healthcare reform and digital solutions to improve care delivery and data management.Tell us your focus area and get a customized research report.
Healthcare Business Intelligence Market Analysis By Product
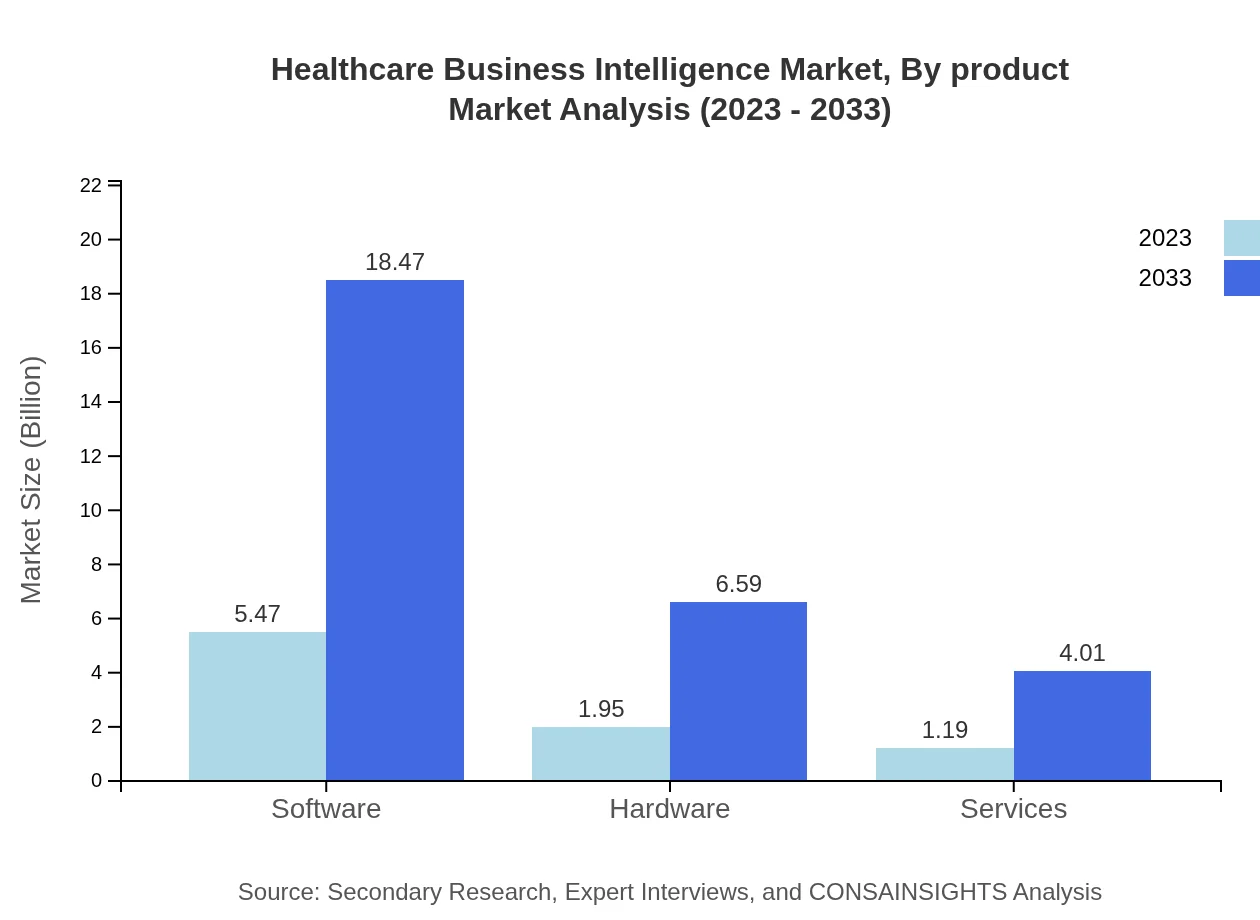
The product segment of the Healthcare Business Intelligence market reflects substantial growth, with software dominating the market size at $5.47 billion in 2023 and projected to reach $18.47 billion by 2033, indicating its central role in data analysis and business intelligence. Hardware and services also play crucial roles, with hardware forecasted to expand from $1.95 billion to $6.59 billion, and services from $1.19 billion to $4.01 billion during the same period.
Healthcare Business Intelligence Market Analysis By Application

Applications of Healthcare Business Intelligence range widely, supporting clinical analytics at $3.79 billion and expected to grow to $12.81 billion, representing a significant focus on improving patient care outcomes. Financial and operational analytics are also critical, with financial analytics projected to increase from $1.80 billion to $6.07 billion, supporting better resource allocation and operational efficiency.
Healthcare Business Intelligence Market Analysis By Deployment Mode
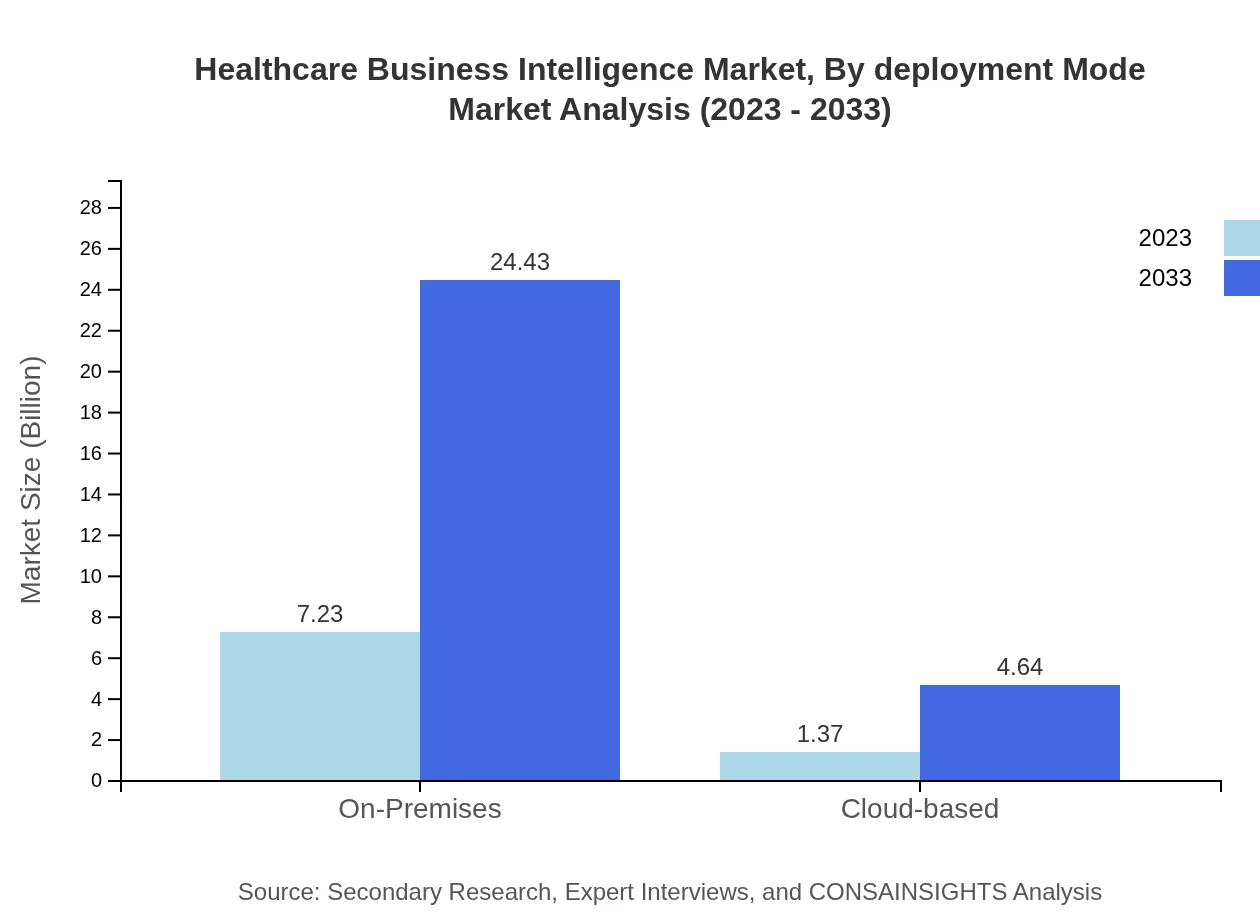
The deployment modes in the Healthcare Business Intelligence market indicate a strong preference for on-premises solutions, expected to increase from $7.23 billion to $24.43 billion. Cloud-based solutions, accounting for $1.37 billion in 2023, are also anticipated to gain traction due to their scalability and collaborative benefits.
Healthcare Business Intelligence Market Analysis By End User
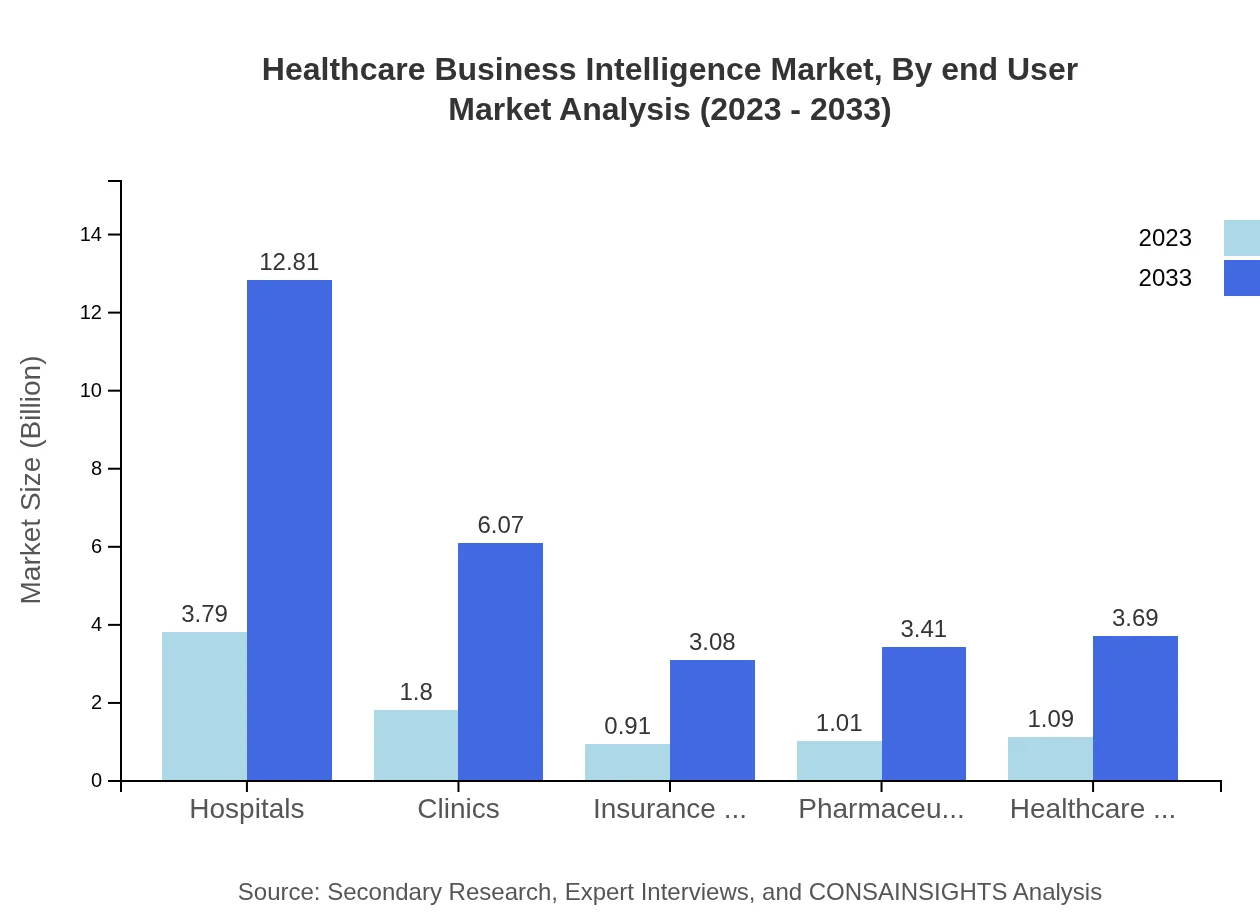
End-users of Healthcare Business Intelligence tools include hospitals, clinics, insurance companies, and pharmaceutical firms. Notably, hospitals lead the market with a valuation of $3.79 billion, growing to $12.81 billion by 2033, reflecting their need for comprehensive analysis tools to enhance patient care and operations.
Healthcare Business Intelligence Market Analysis By Technology

Technological advancements such as Big Data Analytics and Artificial Intelligence are central to the Healthcare Business Intelligence market. Big Data Analytics is projected to grow from $5.47 billion in 2023 to $18.47 billion, while AI applications are expected to increase from $1.95 billion to $6.59 billion, highlighting the sector's reliance on innovative analytic tools.
Healthcare Business Intelligence Market Trends and Future Forecast
Tell us your focus area and get a customized research report.
Global Market Leaders and Top Companies in Healthcare Business Intelligence Industry
IBM Watson Health:
A leader in AI and data analytics, IBM Watson Health helps organizations leverage data insights to improve decision-making and patient care.Tableau Software:
Specializes in business analytics solutions, offering intuitive tools for healthcare providers to visualize and understand their data effectively.SAP SE:
Offers powerful solutions to support healthcare analytics, focusing on integrating data from various sources for robust insights.Oracle Corporation:
Provides a comprehensive suite of healthcare analytics solutions, focusing on enhancing operational efficiency and clinical outcomes.Microsoft:
Utilizes its Azure cloud platform to provide healthcare organizations with advanced analytics and business intelligence tools, improving data accessibility and insights.We're grateful to work with incredible clients.


FAQs
What is the market size of healthcare Business Intelligence?
The healthcare business intelligence market is valued at approximately $8.6 billion in 2023, with a Compound Annual Growth Rate (CAGR) of 12.4%, indicating robust growth potential and significant advancements in this sector over the next decade.
What are the key market players or companies in this healthcare Business Intelligence industry?
Key players in the healthcare business intelligence industry include IBM, Oracle, Microsoft, SAP, and SAS, among others. These companies drive innovation and offer solutions that leverage data analytics, artificial intelligence, and operational effectiveness.
What are the primary factors driving the growth in the healthcare business intelligence industry?
Primary growth drivers include the increasing demand for data analytics in decision-making, rising healthcare costs, the push for improved patient outcomes, and growing regulatory requirements, all contributing to the expanding market scope.
Which region is the fastest Growing in the healthcare business intelligence?
Asia Pacific is the fastest-growing region for healthcare business intelligence, projected to rise from $1.65 billion in 2023 to $5.56 billion by 2033, marking significant market expansion and heightened investment in healthcare technologies.
Does ConsaInsights provide customized market report data for the healthcare business intelligence industry?
Yes, ConsaInsights offers customizable market report data tailored to the specific needs of clients within the healthcare business intelligence sector, ensuring access to relevant insights and competitive analysis.
What deliverables can I expect from this healthcare business intelligence market research project?
Deliverables from this market research project include comprehensive reports, detailed market analysis, segmented data, trend forecasts, competitive landscape insights, and actionable recommendations based on current market dynamics.
What are the market trends of healthcare business intelligence?
Market trends include the integration of artificial intelligence and big data analytics, a shift toward cloud-based solutions, increased emphasis on patient-centered care, and the growing need for operational and clinical analytics.