
Iot In Chemical Industry Market Report
Published Date: 02 February 2026 | Report Code: iot-in-chemical-industry
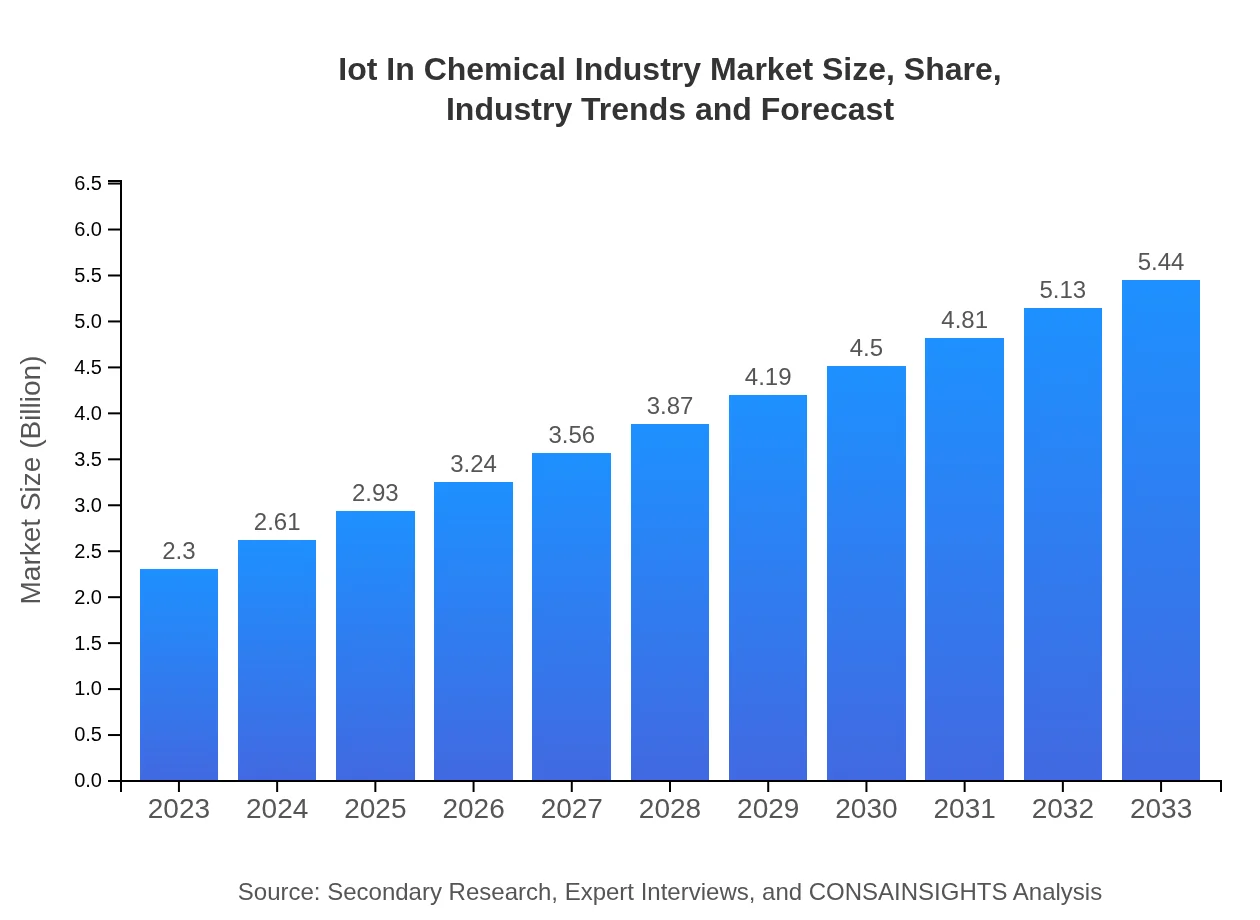
Iot In Chemical Industry Market Size, Share, Industry Trends and Forecast to 2033
This report provides a comprehensive analysis of the IoT in the chemical industry, focusing on market trends, size, segmentation, and regional insights along with a detailed study of the forecast period from 2023 to 2033.
| Metric | Value |
|---|---|
| Study Period | 2023 - 2033 |
| 2023 Market Size | $2.30 Billion |
| CAGR (2023-2033) | 8.7% |
| 2033 Market Size | $5.44 Billion |
| Top Companies | Siemens AG, Honeywell International Inc., Rockwell Automation, Emerson Electric Co., Schneider Electric |
| Last Modified Date | 02 February 2026 |
IoT In Chemical Industry Market Overview
Customize Iot In Chemical Industry Market Report market research report
- ✔ Get in-depth analysis of Iot In Chemical Industry market size, growth, and forecasts.
- ✔ Understand Iot In Chemical Industry's regional dynamics and industry-specific trends.
- ✔ Identify potential applications, end-user demand, and growth segments in Iot In Chemical Industry
What is the Market Size & CAGR of IoT In Chemical Industry market in 2023?
IoT In Chemical Industry Analysis
IoT In Chemical Industry Market Segmentation and Scope
Tell us your focus area and get a customized research report.
IoT In Chemical Industry Market Analysis Report by Region
Europe Iot In Chemical Industry Market Report:
The European market is estimated to rise from $0.62 billion in 2023 to $1.47 billion in 2033. Regulatory pressure for improved environmental outcomes and sustainability has been a strong catalyst for the adoption of IoT technologies. Countries like Germany, France, and the UK are leading the charge.Asia Pacific Iot In Chemical Industry Market Report:
In the Asia Pacific region, the IoT in chemical market is projected to grow from $0.49 billion in 2023 to $1.15 billion by 2033. The rapidly evolving industrial sectors, coupled with the push towards automation and smart manufacturing, are driving this growth. Countries such as Japan, China, and India are leading the digital transformation within their chemical industries, supported by favorable government policies and investments in technology.North America Iot In Chemical Industry Market Report:
North America is anticipated to increase from $0.81 billion in 2023 to $1.91 billion by 2033, primarily driven by the United States. The region is characterized by significant technological advancements and the early adoption of IoT solutions, facilitated by substantial investments and research initiatives.South America Iot In Chemical Industry Market Report:
South America is forecasted to see growth from $0.11 billion in 2023 to $0.26 billion by 2033, with Brazil and Chile at the forefront. The increasing focus on environmental sustainability and the need for operational efficiency are motivating companies to adopt IoT technologies more aggressively.Middle East & Africa Iot In Chemical Industry Market Report:
The Middle East and Africa region are expected to grow from $0.27 billion in 2023 to $0.65 billion by 2033. The oil and gas sector, a major economic driver in this region, is increasingly looking to IoT technologies for enhanced efficiency and compliance with international standards.Tell us your focus area and get a customized research report.
Iot In Chemical Industry Market Analysis By Solution

The IoT in the chemical industry can be segmented into several solutions. Notably, monitoring solutions represent the largest segment with a market size of $1.56 billion in 2023, expected to grow to $3.69 billion by 2033. Data analysis solutions, crucial for optimizing operations and enhancing decision-making, contribute a significant $0.60 billion in 2023, with expectations to reach $1.42 billion. Automation solutions, while smaller, are also growing, projected to increase from $0.14 billion to $0.34 billion.
Iot In Chemical Industry Market Analysis By Application
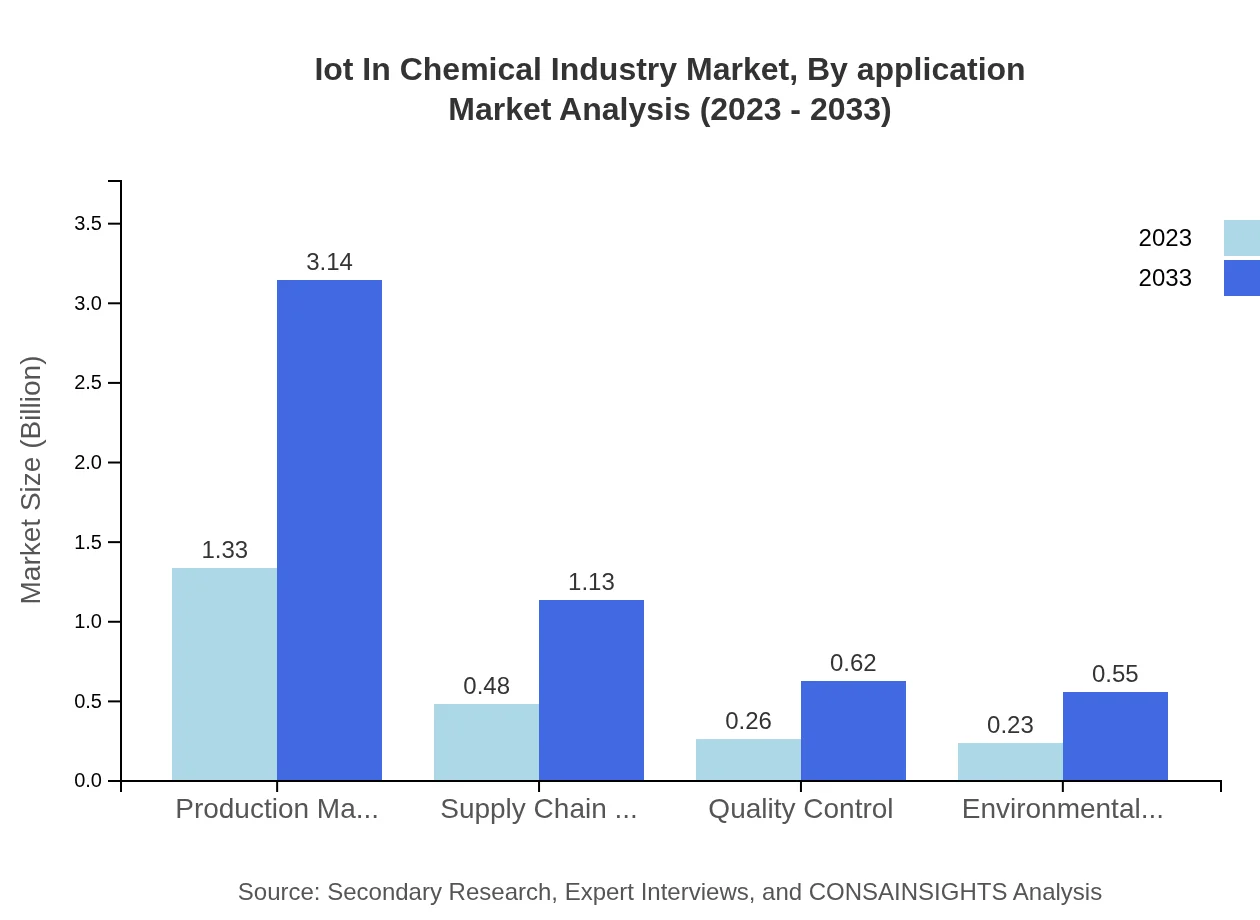
The applications of IoT in the chemical industry include production management, supply chain optimization, quality control, and environmental monitoring. Production management leads the segment with considerable size and market share of $1.33 billion and 57.72% share in 2023, respectively, set to grow to $3.14 billion by 2033. Supply chain optimization is also significant, valued at $0.48 billion in 2023 and expanding to $1.13 billion, capturing 20.82% share.
Iot In Chemical Industry Market Analysis By Technology
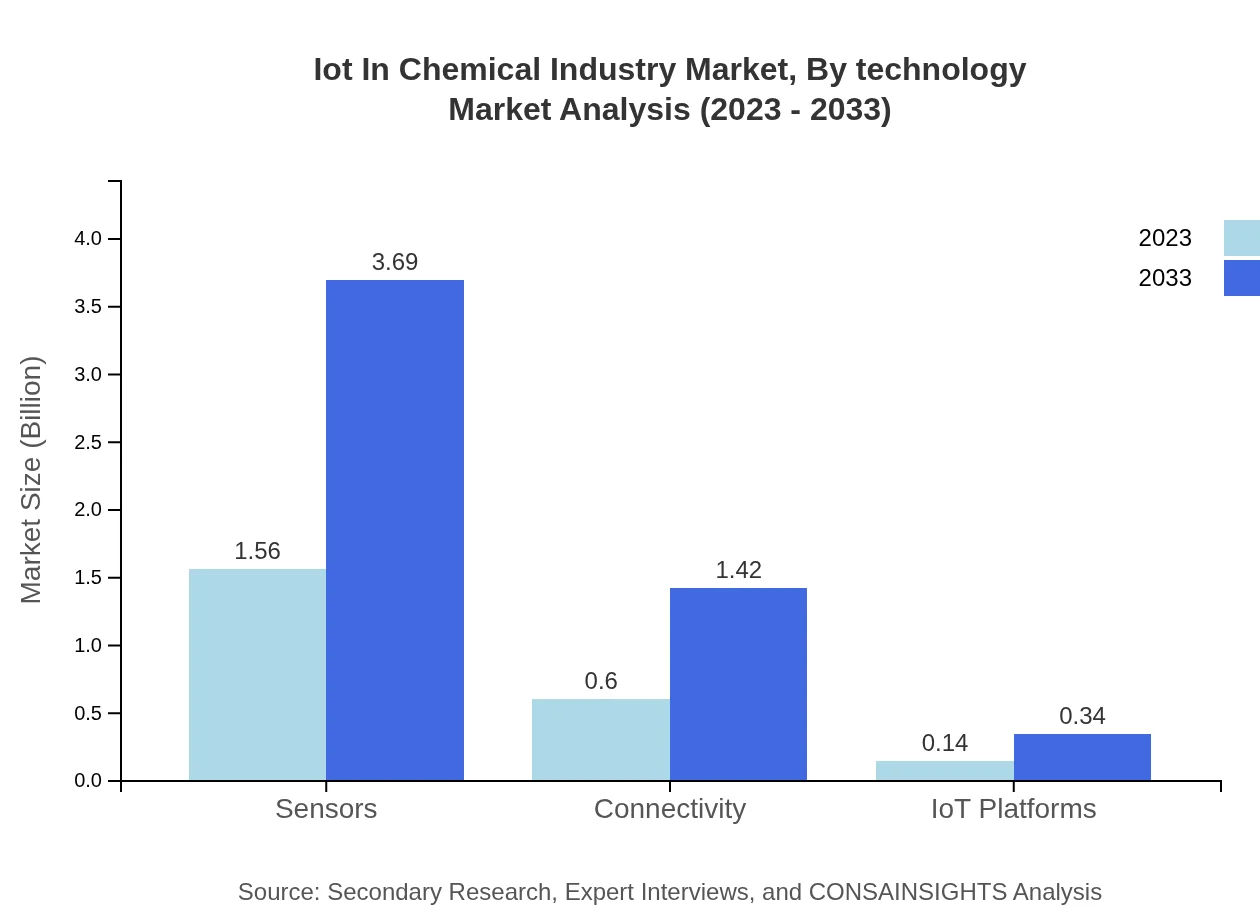
In terms of technology, sensors dominate the IoT market in the chemical industry with a market size of $1.56 billion in 2023, having a 67.7% market share. Connectivity technologies and IoT platforms also play essential roles, with respective sizes of $0.60 billion and $0.14 billion, growing significantly through innovative development and integration.
Iot In Chemical Industry Market Analysis By End User
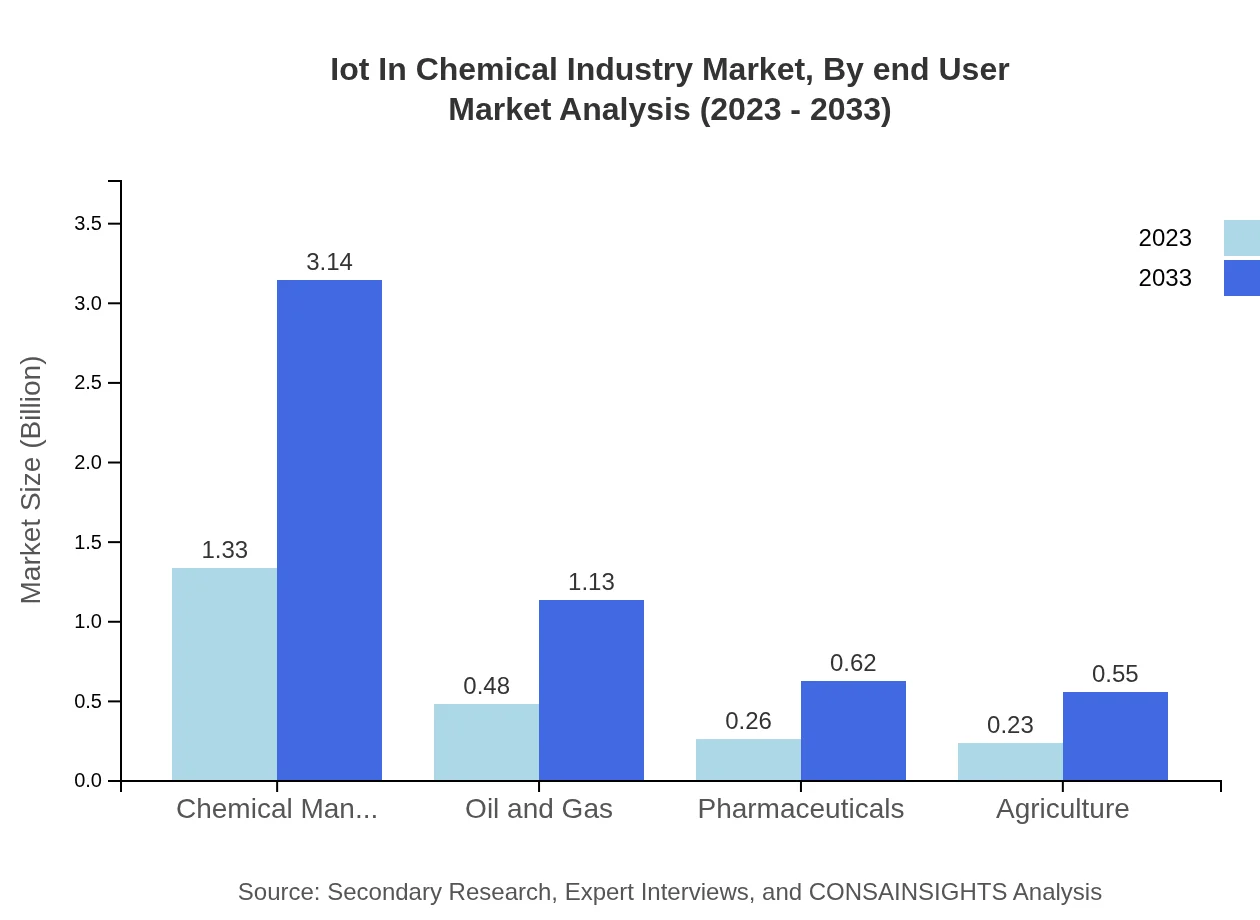
By end-user, chemical manufacturers dominate the market with a size of $1.33 billion and a consistent share of 57.72% in 2023. The oil and gas sector follows, currently valued at $0.48 billion, expected to evolve into a key player as digital transformation accelerates. Pharmaceuticals and agriculture sectors also contribute, with sizes of $0.26 billion and $0.23 billion, respectively.
IoT In Chemical Industry Market Trends and Future Forecast
Tell us your focus area and get a customized research report.
Global Market Leaders and Top Companies in IoT In Chemical Industry Industry
Siemens AG:
Siemens AG is a global leader in automation and digitalization technology, offering solutions that enhance efficiency in the chemical sector.Honeywell International Inc.:
With a strong portfolio in process automation, Honeywell provides comprehensive IoT solutions to monitor and optimize chemical production.Rockwell Automation:
Rockwell Automation specializes in industrial automation and information, providing integrated IoT solutions for the chemical industry.Emerson Electric Co.:
Emerson is known for its innovative technologies and solutions designed to optimize processes and improve operational efficiency in the chemical sector.Schneider Electric:
Schneider Electric offers advanced IoT platforms and software designed to enhance energy management and automation for the chemical industry.We're grateful to work with incredible clients.


FAQs
What is the market size of IoT in the chemical industry?
The IoT in the chemical industry market is valued at approximately $2.3 billion in 2023, with a projected CAGR of 8.7%. By 2033, the market is expected to expand significantly, reflecting increasing adoption of IoT technologies.
What are the key market players or companies in the IoT in the chemical industry?
Key market players include leading chemical manufacturing firms, technology companies specializing in IoT solutions, and service providers focused on integrating IoT for optimized operations in the chemical sector.
What are the primary factors driving the growth in the IoT in the chemical industry?
Growth is driven by increasing demand for operational efficiency, real-time monitoring, regulatory compliance, enhanced safety measures, and the integration of advanced data analytics in chemical processes.
Which region is the fastest Growing in the IoT in the chemical industry?
Asia Pacific is the fastest-growing region in the IoT in the chemical industry, with market growth from $0.49 billion in 2023 to an anticipated $1.15 billion by 2033, showcasing robust investment and adoption rates.
Does ConsaInsights provide customized market report data for the IoT in the chemical industry?
Yes, ConsaInsights offers customized market report data tailored to specific client needs, enabling stakeholders to gain insights aligned with their strategic objectives in the IoT in the chemical industry.
What deliverables can I expect from this IoT in the chemical industry market research project?
Deliverables include comprehensive market analysis reports, segmentation insights, competitive landscape evaluations, regional market forecasts, and trend analyses tailored to support strategic decision-making.
What are the market trends of IoT in the chemical industry?
Market trends include increased automation, greater reliance on data analytics, enhanced connectivity solutions, and a growing emphasis on sustainability, as chemical companies adopt IoT for improved operational performance.