
Marketing Automation Market Report
Published Date: 02 February 2026 | Report Code: marketing-automation
Marketing Automation Market Size, Share, Industry Trends and Forecast to 2033
This report delivers a comprehensive analysis of the marketing automation market, offering insights into trends, size, segmentation, and competitive landscape. Forecasting from 2023 to 2033, it outlines key drivers and challenges, providing businesses with critical information for strategic decisions.
| Metric | Value |
|---|---|
| Study Period | 2023 - 2033 |
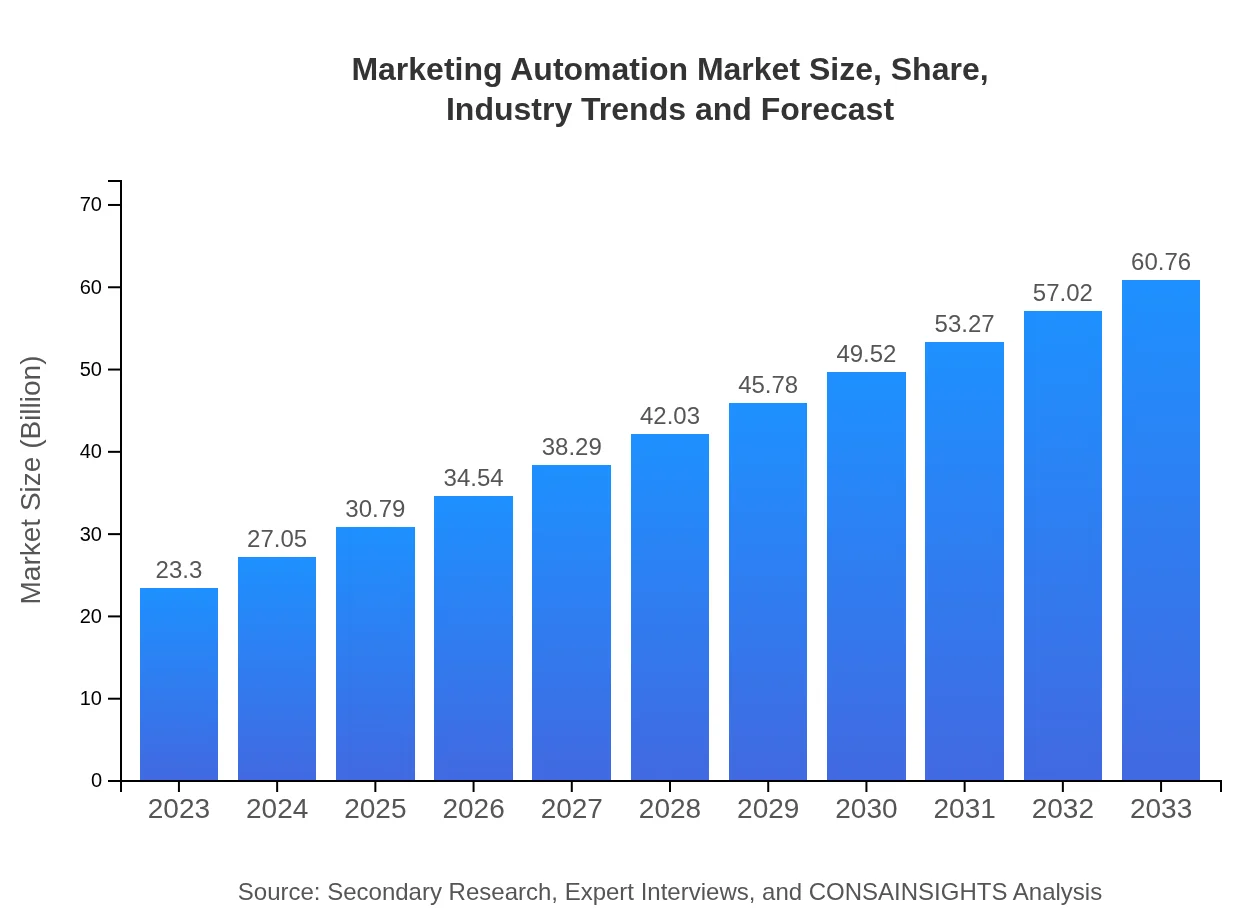
| 2023 Market Size | $23.30 Billion |
| CAGR (2023-2033) | 9.7% |
| 2033 Market Size | $60.76 Billion |
| Top Companies | HubSpot, Salesforce, Marketo, Oracle Eloqua, ActiveCampaign |
| Last Modified Date | 02 February 2026 |
Marketing Automation Market Overview
Customize Marketing Automation Market Report market research report
- ✔ Get in-depth analysis of Marketing Automation market size, growth, and forecasts.
- ✔ Understand Marketing Automation's regional dynamics and industry-specific trends.
- ✔ Identify potential applications, end-user demand, and growth segments in Marketing Automation
What is the Market Size & CAGR of Marketing Automation market in 2023?
Marketing Automation Industry Analysis
Marketing Automation Market Segmentation and Scope
Tell us your focus area and get a customized research report.
Marketing Automation Market Analysis Report by Region
Europe Marketing Automation Market Report:
Europe's marketing automation market is predicted to rise substantially, from $6.26 billion in 2023 to $16.32 billion by 2033. The region's focus on personalized marketing and regulatory frameworks around data management fuel this growth.Asia Pacific Marketing Automation Market Report:
In the Asia Pacific region, the marketing automation market size is projected to grow from $4.46 billion in 2023 to $11.62 billion by 2033, reflecting a strong increase as businesses improve their digital marketing capabilities and utilize automation tools to enhance customer engagement.North America Marketing Automation Market Report:
North America remains the largest market for marketing automation, forecasted to expand from $8.66 billion in 2023 to $22.59 billion in 2033. The rise in marketing automation adoption is driven by technological advancements and a significant shift toward data-driven marketing strategies.South America Marketing Automation Market Report:
The South American market is expected to grow from $1.08 billion in 2023 to $2.82 billion in 2033. This growth is spurred by the increasing adoption of digital marketing strategies among businesses seeking to tap into a more connected consumer base.Middle East & Africa Marketing Automation Market Report:
The Middle East and Africa market is set to increase from $2.84 billion in 2023 to $7.41 billion in 2033. Increasing investments in technology and digital marketing are driving regional growth as businesses look to harness automated tools.Tell us your focus area and get a customized research report.
Marketing Automation Market Analysis By Product Type
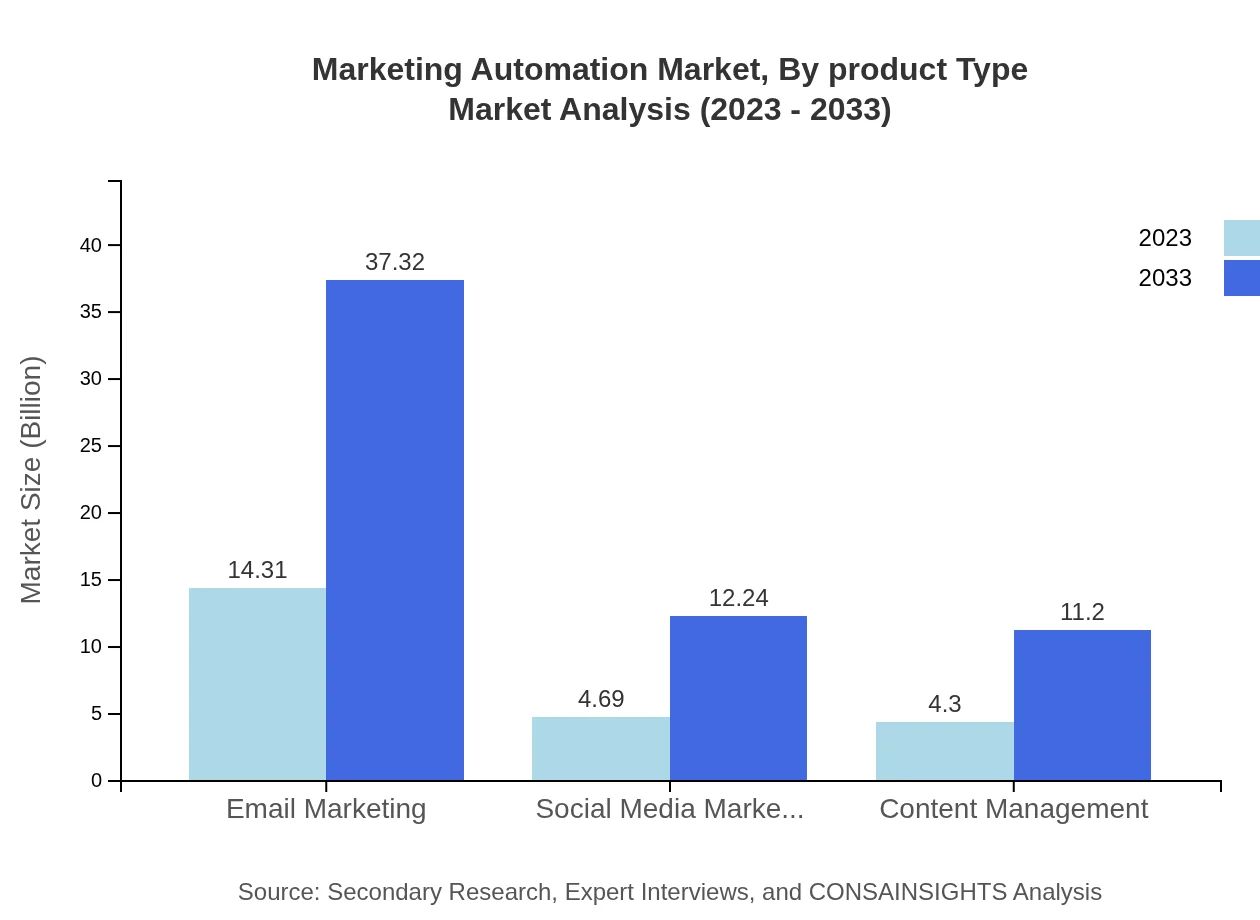
Email marketing leads the product segment, with growth from $12.57 billion in 2023 to $32.77 billion in 2033, while social media marketing is also expanding from $4.94 billion to $12.88 billion. These segments are crucial for businesses aiming to strengthen their digital outreach and engagement.
Marketing Automation Market Analysis By Application

The B2B segment remains dominant, expected to grow from $12.57 billion in 2023 to $32.77 billion in 2033, whereas B2C applications are set to increase from $4.94 billion to $12.88 billion, highlighting the necessity of advanced marketing automation solutions tailored to varying market needs.
Marketing Automation Market Analysis By Channel
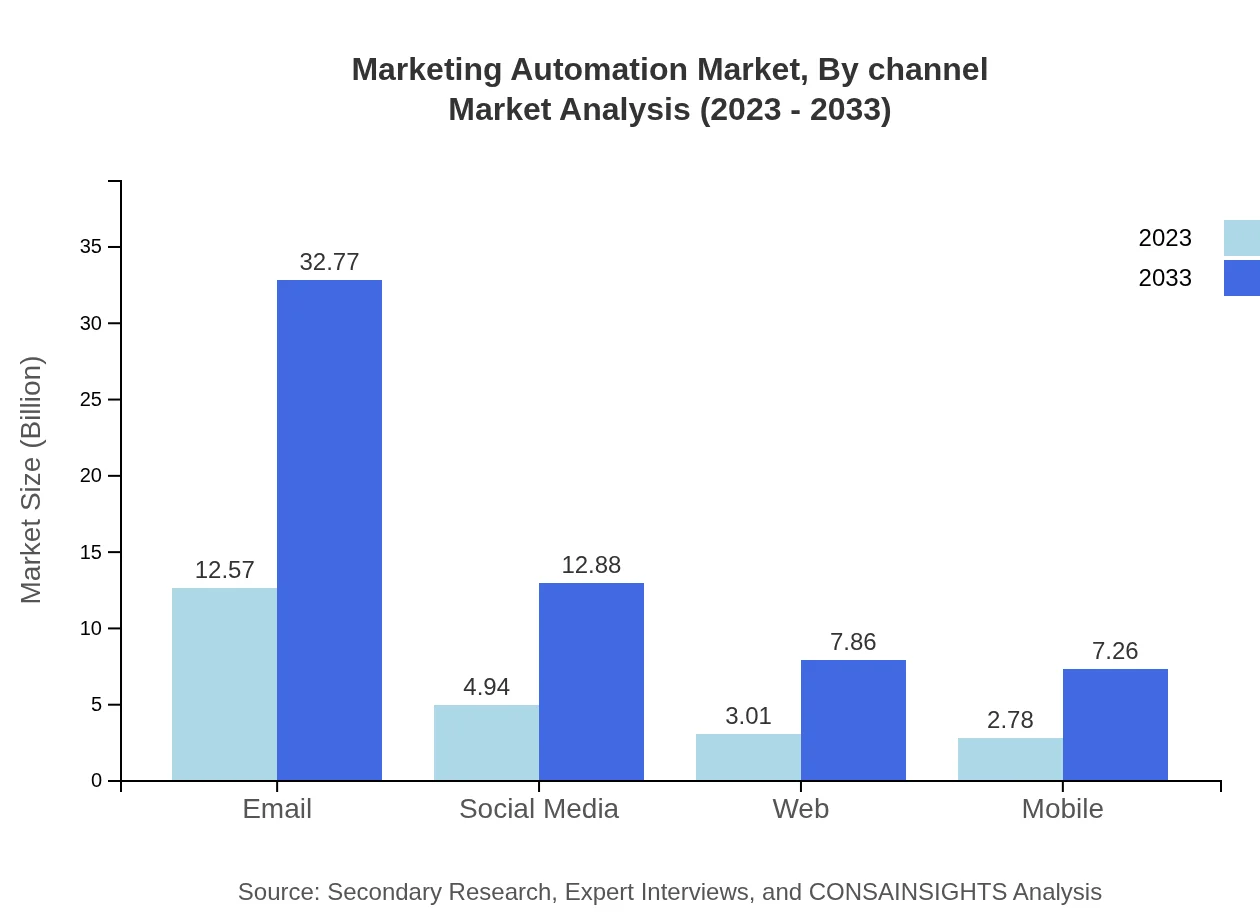
The channel analysis indicates robust growth across email, social media, web, and mobile platforms, essential for reaching diverse consumer demographics. Email channel shows an impressive growth from $12.57 billion to $32.77 billion and social media from $4.94 billion to $12.88 billion by 2033.
Marketing Automation Market Analysis By Deployment Model
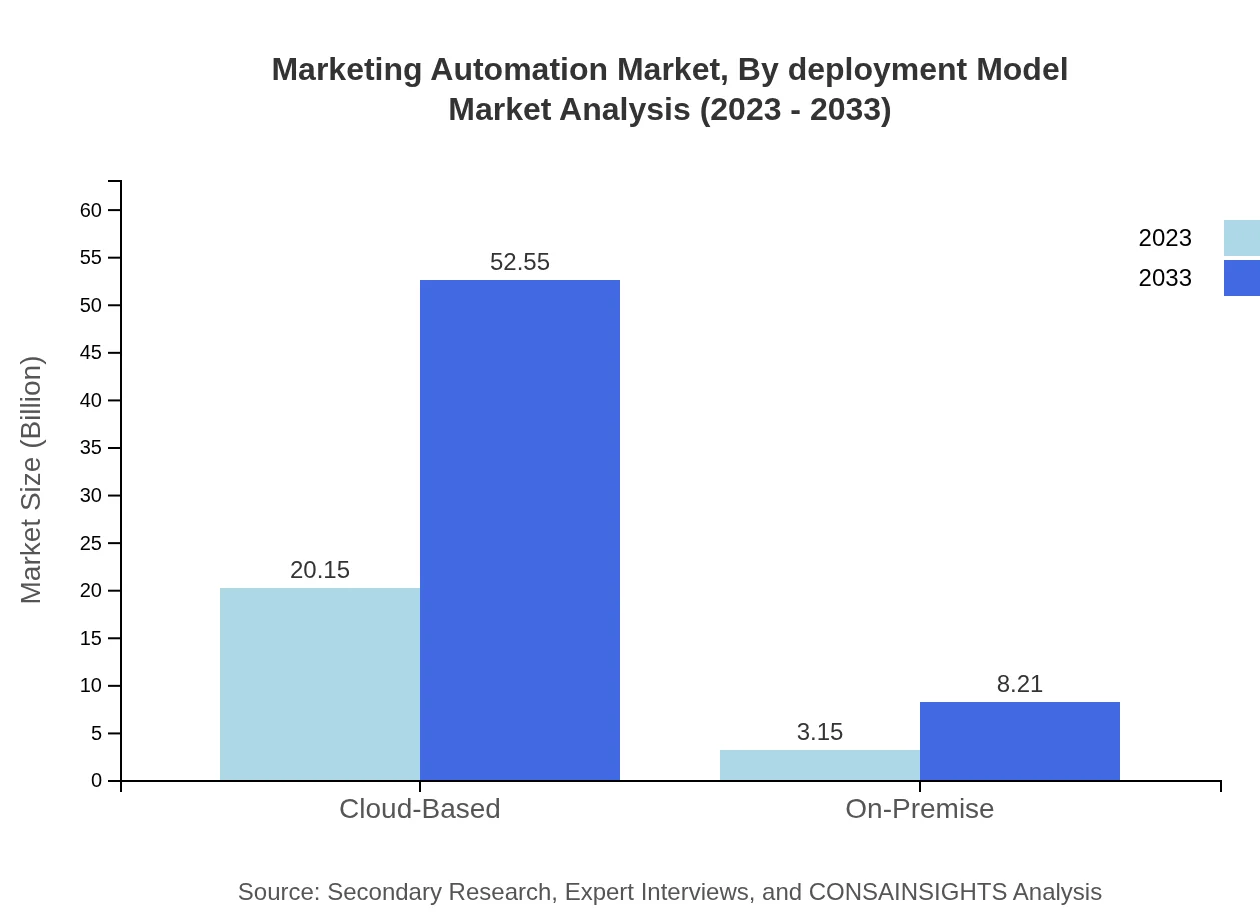
Cloud-based solutions are projected to proliferate, moving from $20.15 billion in 2023 to $52.55 billion by 2033. On-premise solutions, although smaller, are also set to grow from $3.15 billion to $8.21 billion, reflecting a diverse preference among businesses for deployment models.
Marketing Automation Market Analysis By Industry
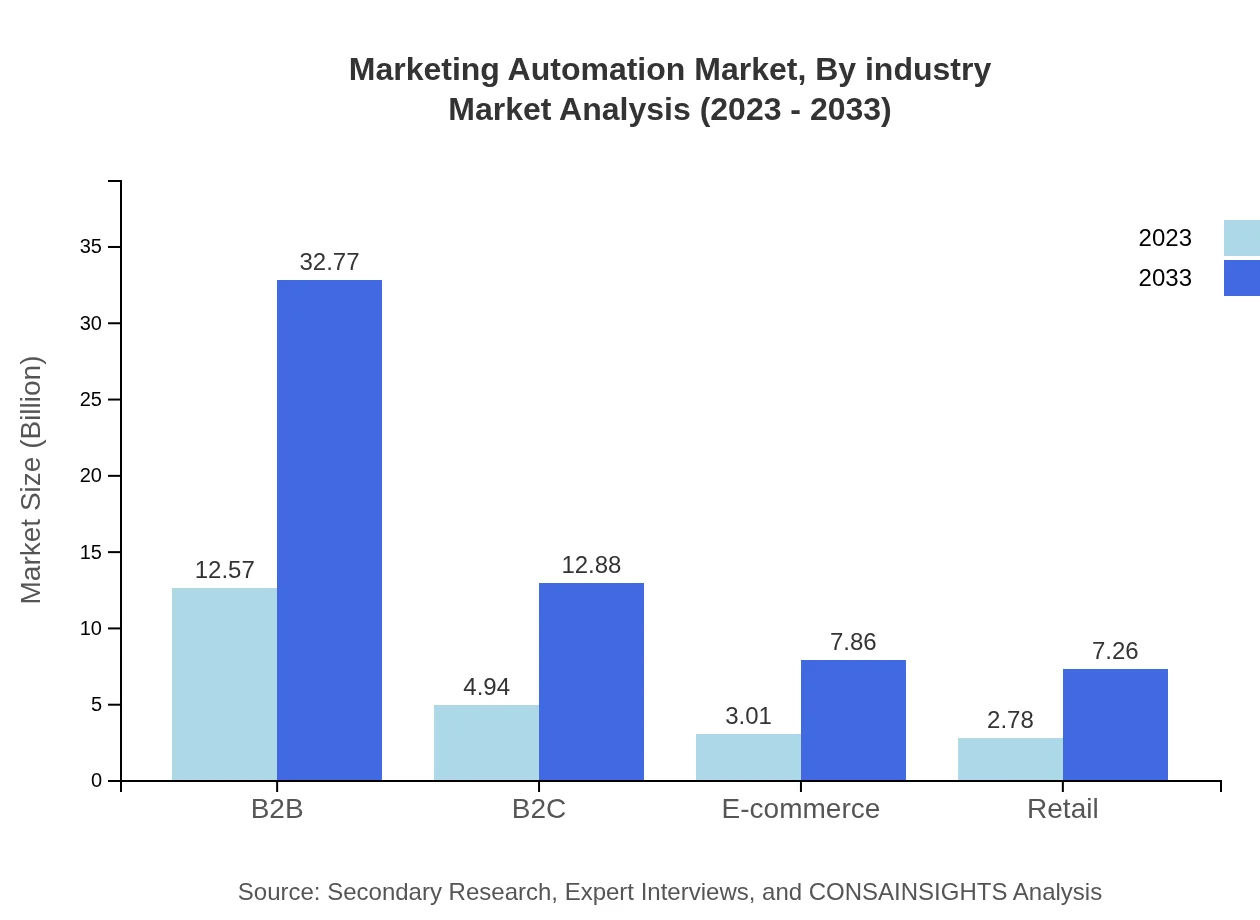
Industries such as retail and e-commerce are accelerating the adoption of marketing automation, with retail growth from $2.78 billion to $7.26 billion and e-commerce from $3.01 billion to $7.86 billion by 2033. This showcases a trend toward digital transformation across sectors.
Marketing Automation Market Trends and Future Forecast
Tell us your focus area and get a customized research report.
Global Market Leaders and Top Companies in Marketing Automation Industry
HubSpot:
Known for its comprehensive inbound marketing tools, HubSpot offers a platform designed for automation, lead generation, and analytics with a robust focus on small and medium-sized businesses.Salesforce:
Salesforce provides cloud-based tools that enable businesses to tailor marketing automation according to customer relationship management, facilitating better targeting and personalization strategies.Marketo:
As part of Adobe, Marketo is renowned for its marketing automation solutions aimed at enterprise clients, optimizing lead management and multi-channel campaigns effectively.Oracle Eloqua:
Oracle Eloqua is notable for sophisticated marketing automation tools that cater to large organizations, helping them manage leads, marketing campaigns, and customer data effectively.ActiveCampaign:
ActiveCampaign combines email marketing, automation, and CRM, aiming to help smaller businesses streamline their marketing processes.We're grateful to work with incredible clients.


FAQs
What is the market size of marketing Automation?
The market size of the Marketing Automation industry is approximately $23.3 billion in 2023, with a projected compound annual growth rate (CAGR) of 9.7% leading to substantial growth by 2033.
What are the key market players or companies in this marketing Automation industry?
Key players in the Marketing Automation industry include Salesforce, HubSpot, Marketo, Adobe, and Oracle. These companies provide comprehensive solutions that enhance marketing efficiency through automation, analytics, and customer relationship management.
What are the primary factors driving the growth in the marketing Automation industry?
Driving factors include increasing adoption of cloud-based services, the necessity for efficient customer engagement, and the growing trend towards personalized marketing. Additionally, the expansion of e-commerce and advancements in data analytics significantly contribute to industry growth.
Which region is the fastest Growing in the marketing Automation market?
The fastest-growing regions for Marketing Automation are North America, projected to grow from $8.66 billion in 2023 to $22.59 billion by 2033, followed by Europe and Asia Pacific, indicating a robust demand across these markets.
Does ConsInsights provide customized market report data for the marketing Automation industry?
Yes, ConsInsights offers customized market reports tailored to specific needs within the Marketing Automation industry, allowing for in-depth analysis and insights that cater to unique business requirements.
What deliverables can I expect from this marketing Automation market research project?
Deliverables typically include comprehensive reports, market segmentation analysis, growth projections, competitive landscape assessments, and actionable insights, providing a well-rounded understanding of the Marketing Automation market.
What are the market trends of marketing Automation?
Current trends include the rise of AI and machine learning, increased focus on customer experience, integration of multi-channel marketing strategies, and the growing importance of data privacy, shaping the future landscape of Marketing Automation.