Reports >
Food And Beverages
>
Non Meat Ingredients Market Report

Non Meat Ingredients Market Report
Published Date: 31 January 2026 | Report Code: non-meat-ingredients
Non Meat Ingredients Market Size, Share, Industry Trends and Forecast to 2033
This report provides in-depth insights into the Non Meat Ingredients market, covering market trends, growth forecasts from 2023 to 2033, and regional analyses. It aims to present data-driven insights to better understand this evolving industry.
| Metric | Value |
|---|---|
| Study Period | 2023 - 2033 |
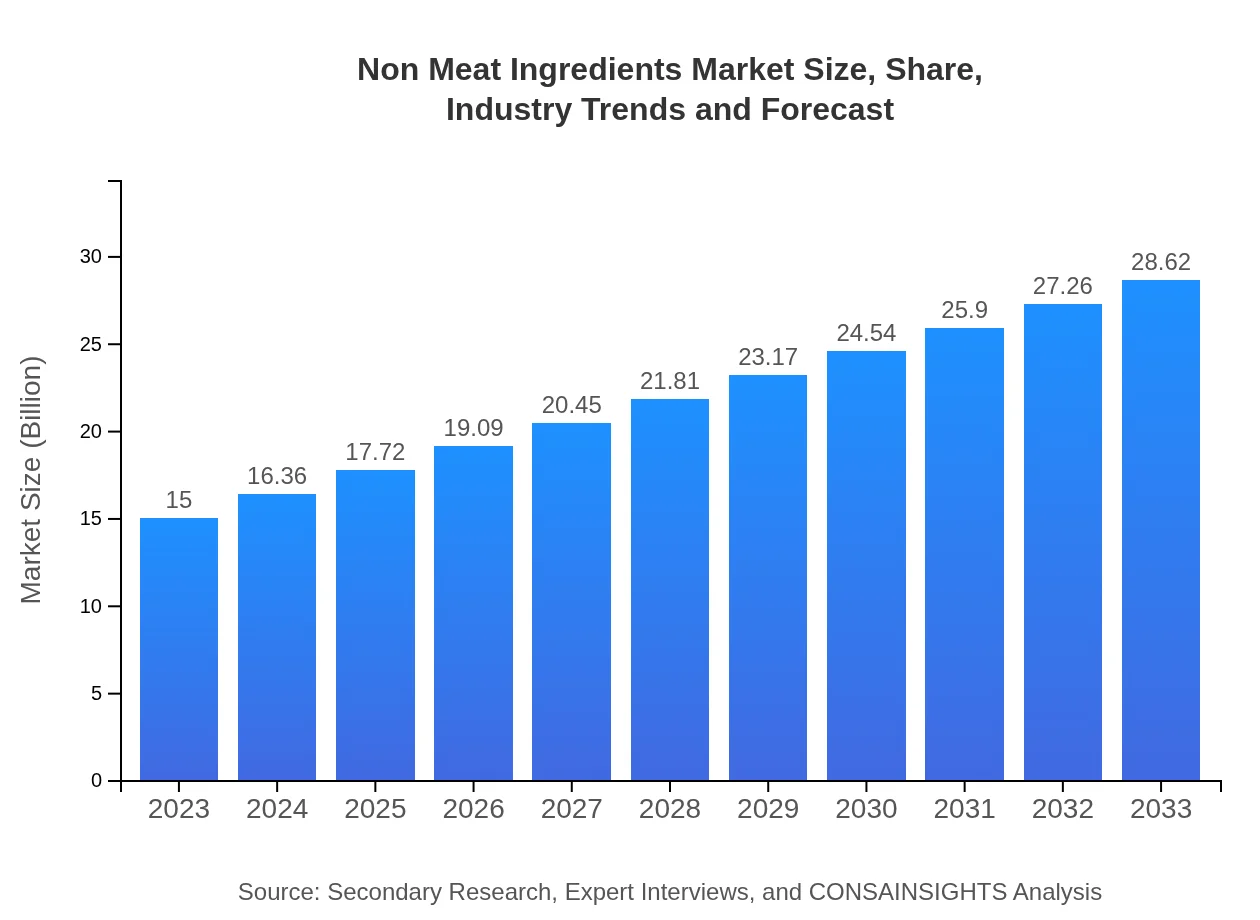
| 2023 Market Size | $15.00 Billion |
| CAGR (2023-2033) | 6.5% |
| 2033 Market Size | $28.62 Billion |
| Top Companies | Nestlé S.A., DuPont de Nemours, Inc., Cargill, Inc., Unilever |
| Last Modified Date | 31 January 2026 |
Non Meat Ingredients Market Overview
Customize Non Meat Ingredients Market Report market research report
- ✔ Get in-depth analysis of Non Meat Ingredients market size, growth, and forecasts.
- ✔ Understand Non Meat Ingredients's regional dynamics and industry-specific trends.
- ✔ Identify potential applications, end-user demand, and growth segments in Non Meat Ingredients
What is the Market Size & CAGR of Non Meat Ingredients market in 2023?
Non Meat Ingredients Industry Analysis
Non Meat Ingredients Market Segmentation and Scope
Tell us your focus area and get a customized research report.
Non Meat Ingredients Market Analysis Report by Region
Europe Non Meat Ingredients Market Report:
Europe displays a mature Non Meat Ingredients market, with projections of growth from USD 4.56 billion in 2023 to USD 8.71 billion by 2033. This region leads in regulatory frameworks promoting organic and sustainable food options, paired with a high percentage of consumers adopting vegetarian or flexitarian diets.Asia Pacific Non Meat Ingredients Market Report:
The Asia Pacific region is poised for significant growth, with the market size expected to reach USD 5.20 billion by 2033, up from USD 2.73 billion in 2023. The increasing awareness of health and wellness coupled with the booming food and beverage industry drives this growth. Countries like China and India are leading the shift towards non-meat alternatives, spearheaded by a large population base exploring dietary changes.North America Non Meat Ingredients Market Report:
North America maintains a significant share of the global Non Meat Ingredients market, estimated to grow from USD 5.51 billion in 2023 to USD 10.51 billion by 2033. Factors driving this growth include the strong demand for organic products and plant-based diets, along with a robust retail landscape supporting health-focused food products.South America Non Meat Ingredients Market Report:
South America's Non Meat Ingredients market is on the rise with expectations to grow from USD 0.99 billion in 2023 to USD 1.88 billion by 2033. The increase in vegetarian diets within countries like Brazil and Argentina contributes to this market expansion. Additionally, sustainable practices in food production are gaining momentum in the region, enhancing market prospects.Middle East & Africa Non Meat Ingredients Market Report:
The Middle East and Africa region's Non Meat Ingredients market is expected to grow from USD 1.22 billion in 2023 to USD 2.32 billion by 2033. The increasing urbanization and the rising awareness of healthy eating habits among consumers are driving this demand, alongside initiatives for food security in several African countries.Tell us your focus area and get a customized research report.
Non Meat Ingredients Market Analysis By Type

The Non Meat Ingredients market reveals a dominant trend towards Plant-Based Ingredients, which are projected to grow from USD 9.07 billion in 2023 to USD 17.30 billion by 2033. Fungal Ingredients are expected to escalate from USD 4.33 billion in 2023 to USD 8.26 billion by 2033. Other Non-Meat Ingredients are also anticipated to witness a growth from USD 1.60 billion in 2023 to USD 3.06 billion by 2033.
Non Meat Ingredients Market Analysis By Functionality
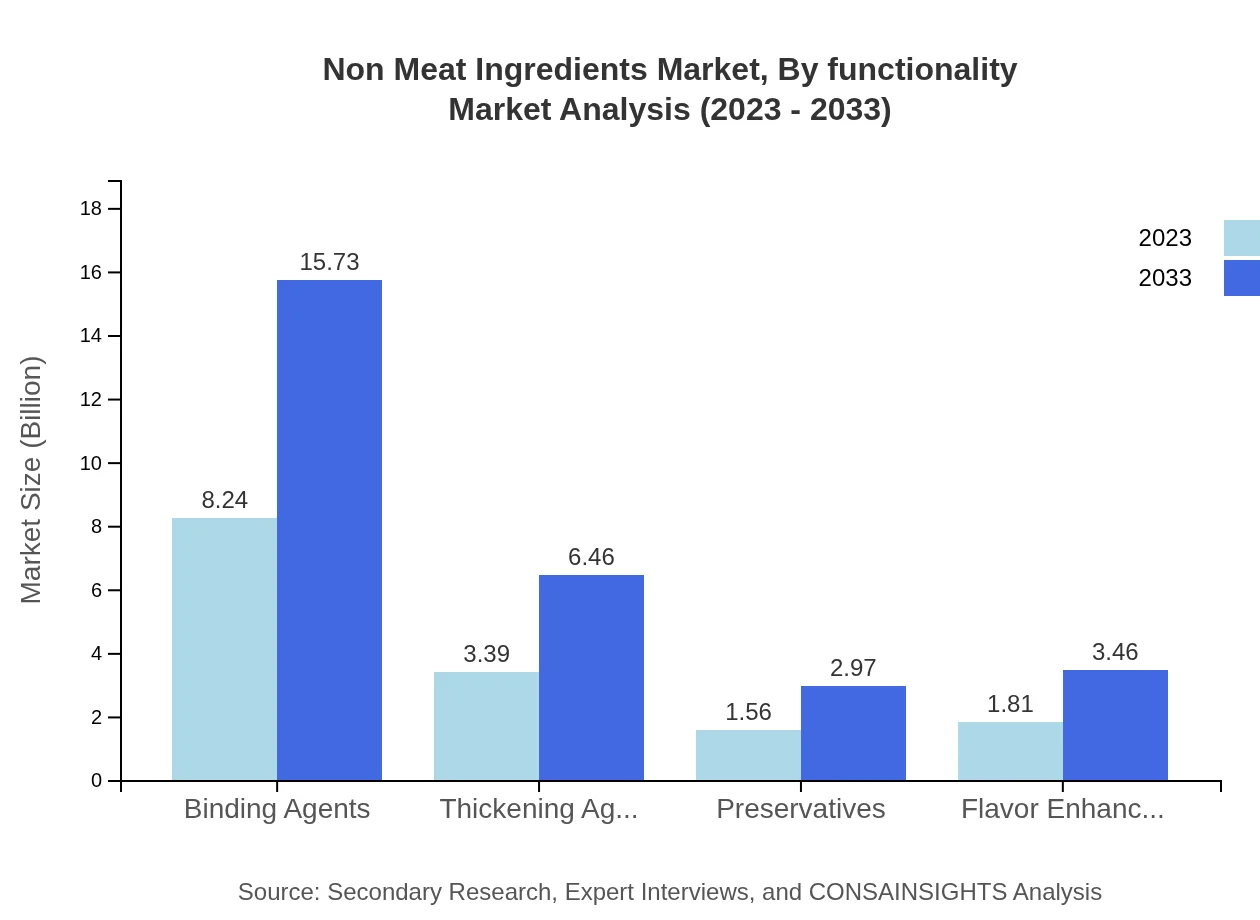
Binding Agents lead the functionality segment with a market size from USD 8.24 billion in 2023 to USD 15.73 billion by 2033. Thickening Agents show significant performance growing from USD 3.39 billion to USD 6.46 billion. Preservatives and Flavor Enhancers hold important positions, contributing USD 1.56 billion and USD 1.81 billion in 2023, respectively.
Non Meat Ingredients Market Analysis By Application
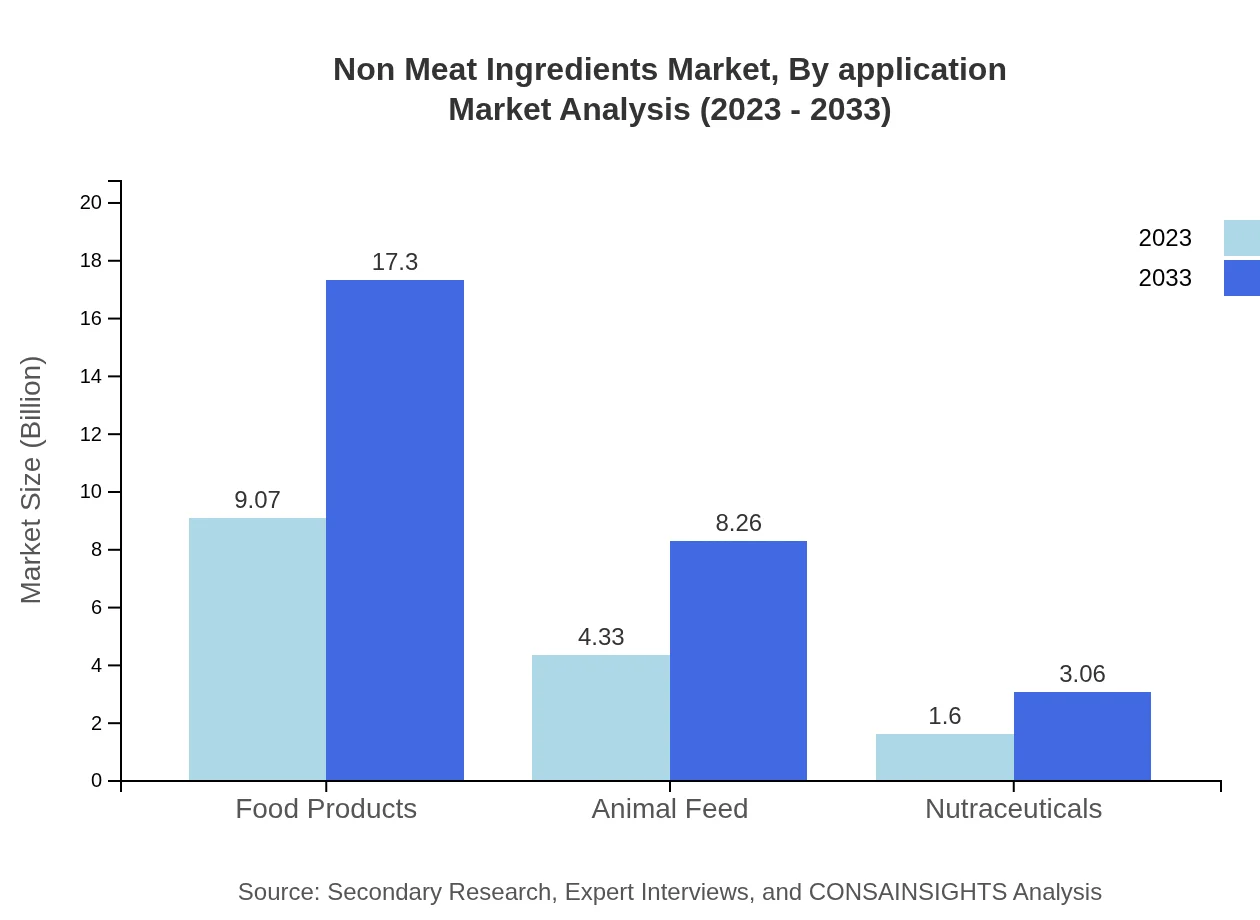
The application of Non-Meat Ingredients is primarily dominated by Food Products, projected to grow from USD 9.07 billion in 2023 to USD 17.30 billion by 2033. The Animal Feed sector also experiences growth from USD 4.33 billion to USD 8.26 billion. Nutraceuticals remain a smaller segment, expanding slowly from USD 1.60 billion to USD 3.06 billion throughout the forecast period.
Non Meat Ingredients Market Analysis By Source
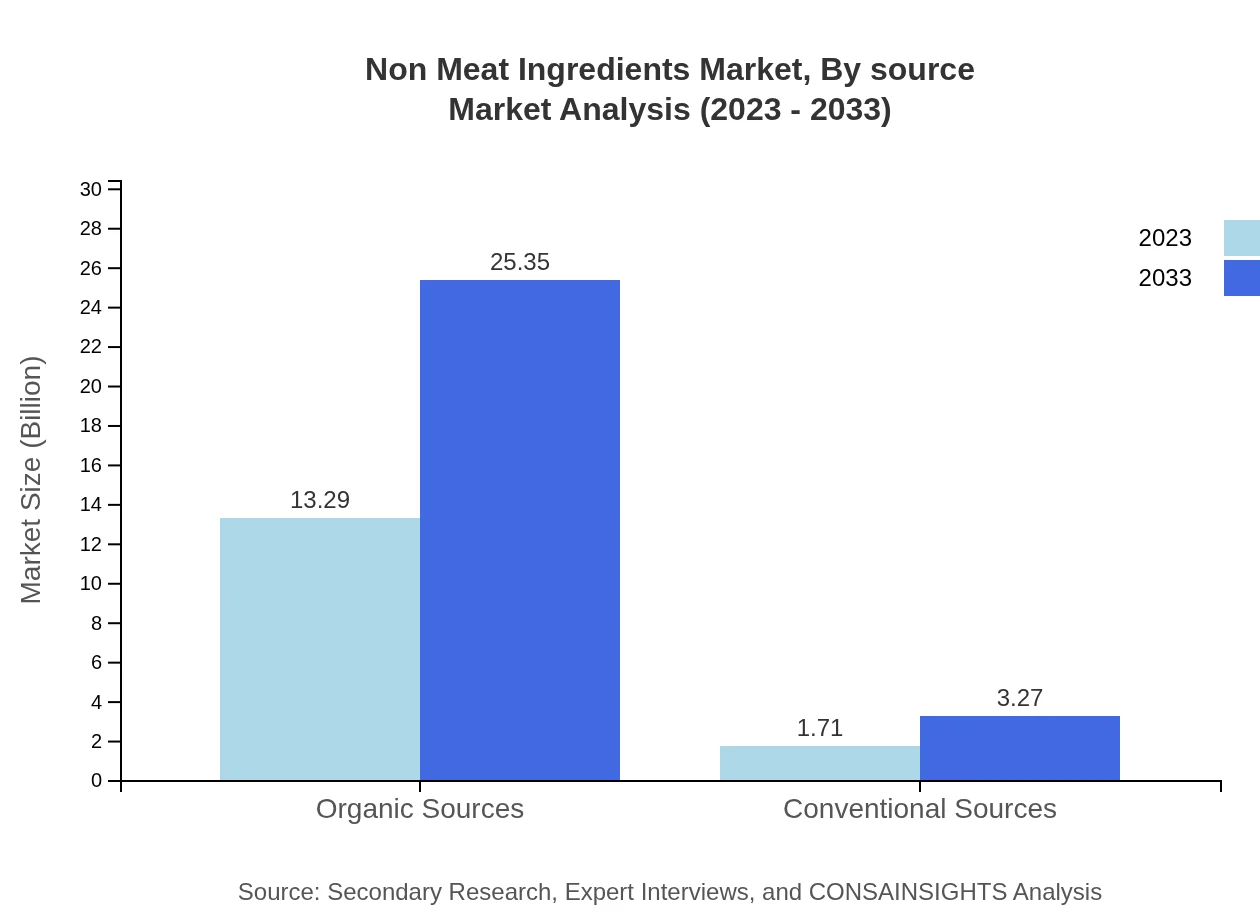
Organic Sources dominate the Non Meat Ingredients market, beginning at USD 13.29 billion in 2023 and anticipated to reach USD 25.35 billion by 2033, reflecting an increasing trend desirous of clean-label products. Conventional Sources are projected to grow from USD 1.71 billion to USD 3.27 billion during the same period, underscoring ongoing shifts in consumer behavior towards healthier options.
Non Meat Ingredients Market Trends and Future Forecast
Tell us your focus area and get a customized research report.
Global Market Leaders and Top Companies in Non Meat Ingredients Industry
Nestlé S.A.:
Nestlé is a global leader in nutrition, health, and wellness, providing a range of plant-based and vegan products aimed at health-conscious consumers.DuPont de Nemours, Inc.:
DuPont specializes in innovative agricultural and industrial biotechnology and offers a variety of plant-based food ingredients that enhance nutritional value.Cargill, Inc.:
Cargill is a major player in the food market and has expanded its portfolio to include various plant-based options, focusing on sustainability and health.Unilever:
Unilever is known for its extensive range of products and includes various plant-based food ingredients, with a commitment to sustainable sourcing.We're grateful to work with incredible clients.


FAQs
What is the market size of Non-Meat Ingredients?
The global Non-Meat Ingredients market is currently valued at approximately $15 billion, with a projected CAGR of 6.5%. This growth reflects the increasing demand for plant-based alternatives and related non-meat ingredients through 2033.
What are the key market players or companies in this Non-Meat Ingredients industry?
Key players in the Non-Meat Ingredients sector include companies specializing in plant-based products, food additive manufacturers, and nutraceutical firms. Their innovations and market strategies are pivotal for growth in this industry.
What are the primary factors driving the growth in the Non-Meat Ingredients industry?
Growth in the Non-Meat Ingredients industry is driven by rising consumer health consciousness, a shift towards sustainable food sources, and increasing vegan and vegetarian diets. Technological advancements in food processing also bolster this growth.
Which region is the fastest Growing in the Non-Meat Ingredients?
The fastest-growing regional market for Non-Meat Ingredients is North America, projected to increase from $5.51 billion in 2023 to $10.51 billion by 2033, showcasing significant demand for non-meat alternatives.
Does ConsaInsights provide customized market report data for the Non-Meat Ingredients industry?
Yes, ConsaInsights offers customized market report data specific to the Non-Meat Ingredients industry, allowing clients to tailor insights based on unique business needs and market dynamics.
What deliverables can I expect from this Non-Meat Ingredients market research project?
Deliverables from the Non-Meat Ingredients market research include comprehensive market analysis, trends, competitive landscape, segmentation data, and forecasts, providing actionable insights for strategic decision-making.
What are the market trends of Non-Meat Ingredients?
Current market trends in Non-Meat Ingredients include a surge in demand for plant-based ingredients, innovations in food formulations, and the rise of organic products, all of which are reshaping industry dynamics.