
Optical Emission Spectroscopy Market Report
Published Date: 31 January 2026 | Report Code: optical-emission-spectroscopy
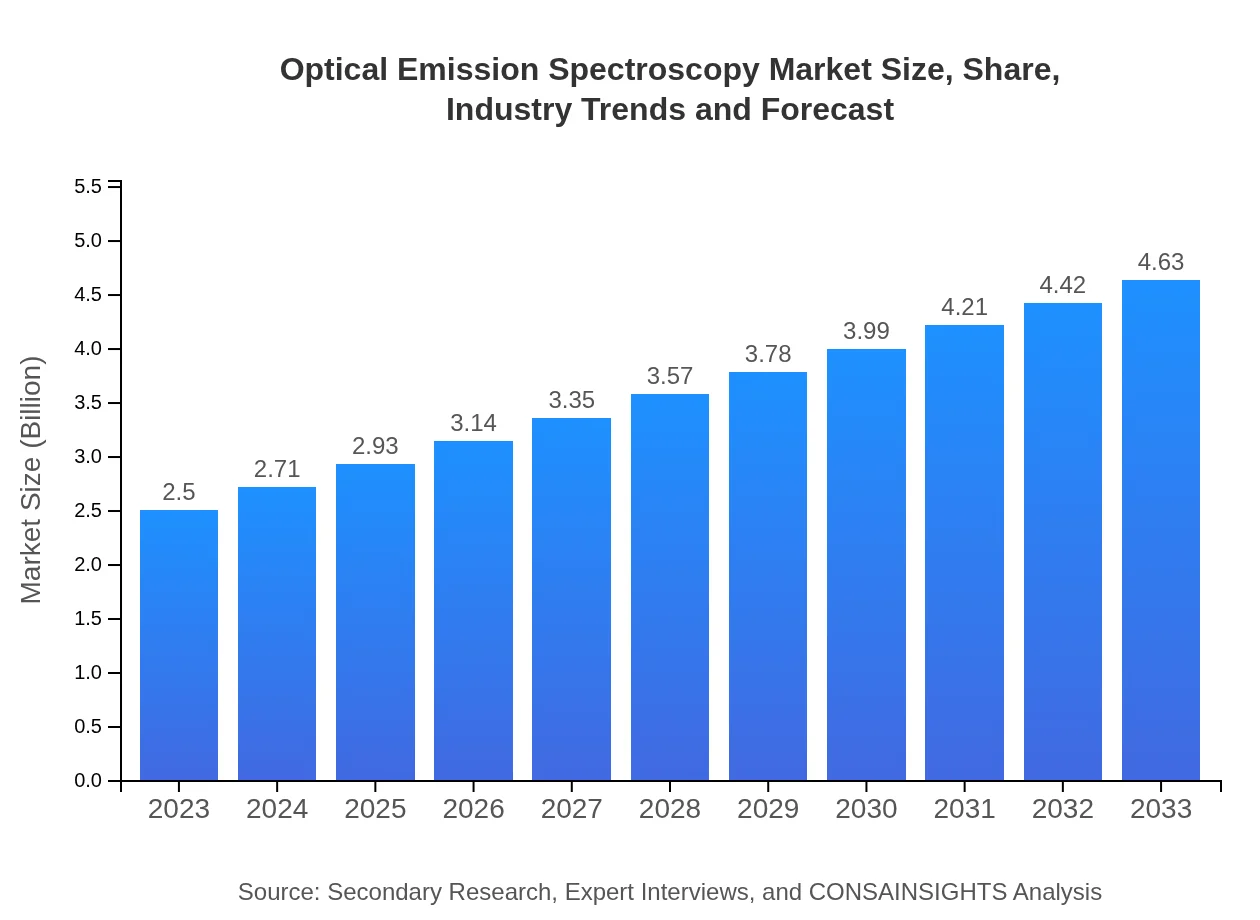
Optical Emission Spectroscopy Market Size, Share, Industry Trends and Forecast to 2033
This report provides an in-depth analysis of the Optical Emission Spectroscopy market, highlighting key trends, market size estimates, CAGR, segment dynamics, and regional insights for the forecast period 2023-2033.
| Metric | Value |
|---|---|
| Study Period | 2023 - 2033 |
| 2023 Market Size | $2.50 Billion |
| CAGR (2023-2033) | 6.2% |
| 2033 Market Size | $4.63 Billion |
| Top Companies | Thermo Fisher Scientific, Agilent Technologies, Horiba Scientific, PerkinElmer |
| Last Modified Date | 31 January 2026 |
Optical Emission Spectroscopy Market Overview
Customize Optical Emission Spectroscopy Market Report market research report
- ✔ Get in-depth analysis of Optical Emission Spectroscopy market size, growth, and forecasts.
- ✔ Understand Optical Emission Spectroscopy's regional dynamics and industry-specific trends.
- ✔ Identify potential applications, end-user demand, and growth segments in Optical Emission Spectroscopy
What is the Market Size & CAGR of Optical Emission Spectroscopy market in 2023?
Optical Emission Spectroscopy Industry Analysis
Optical Emission Spectroscopy Market Segmentation and Scope
Tell us your focus area and get a customized research report.
Optical Emission Spectroscopy Market Analysis Report by Region
Europe Optical Emission Spectroscopy Market Report:
Europe's market is projected to grow from $0.75 billion in 2023 to $1.40 billion by 2033. The region's stringent safety and quality regulations in sectors such as chemicals and pharmaceuticals and the drive towards innovation propel market growth.Asia Pacific Optical Emission Spectroscopy Market Report:
In the Asia Pacific region, the market is expected to grow from $0.48 billion in 2023 to $0.88 billion by 2033. Growth drivers include increasing industrial manufacturing and stringent environmental regulations, particularly in countries like China and India. The rising investments in R&D also contribute to upward market momentum.North America Optical Emission Spectroscopy Market Report:
North America, holding the largest market share, is projected to increase from $0.89 billion in 2023 to $1.64 billion by 2033. The presence of key manufacturers and high investment in research and development activities are significant growth drivers.South America Optical Emission Spectroscopy Market Report:
South America's OES market is forecasted to expand from $0.17 billion in 2023 to $0.31 billion by 2033. The growth is primarily supported by developments in the mining and metallurgical sectors, where OES is essential for quality control and compliance with regulations.Middle East & Africa Optical Emission Spectroscopy Market Report:
The Middle East and Africa market for OES is anticipated to increase from $0.22 billion in 2023 to $0.40 billion by 2033. Regional growth is spurred by investments in oil and gas, along with increasing awareness surrounding environmental testing.Tell us your focus area and get a customized research report.
Optical Emission Spectroscopy Market Analysis By Technology
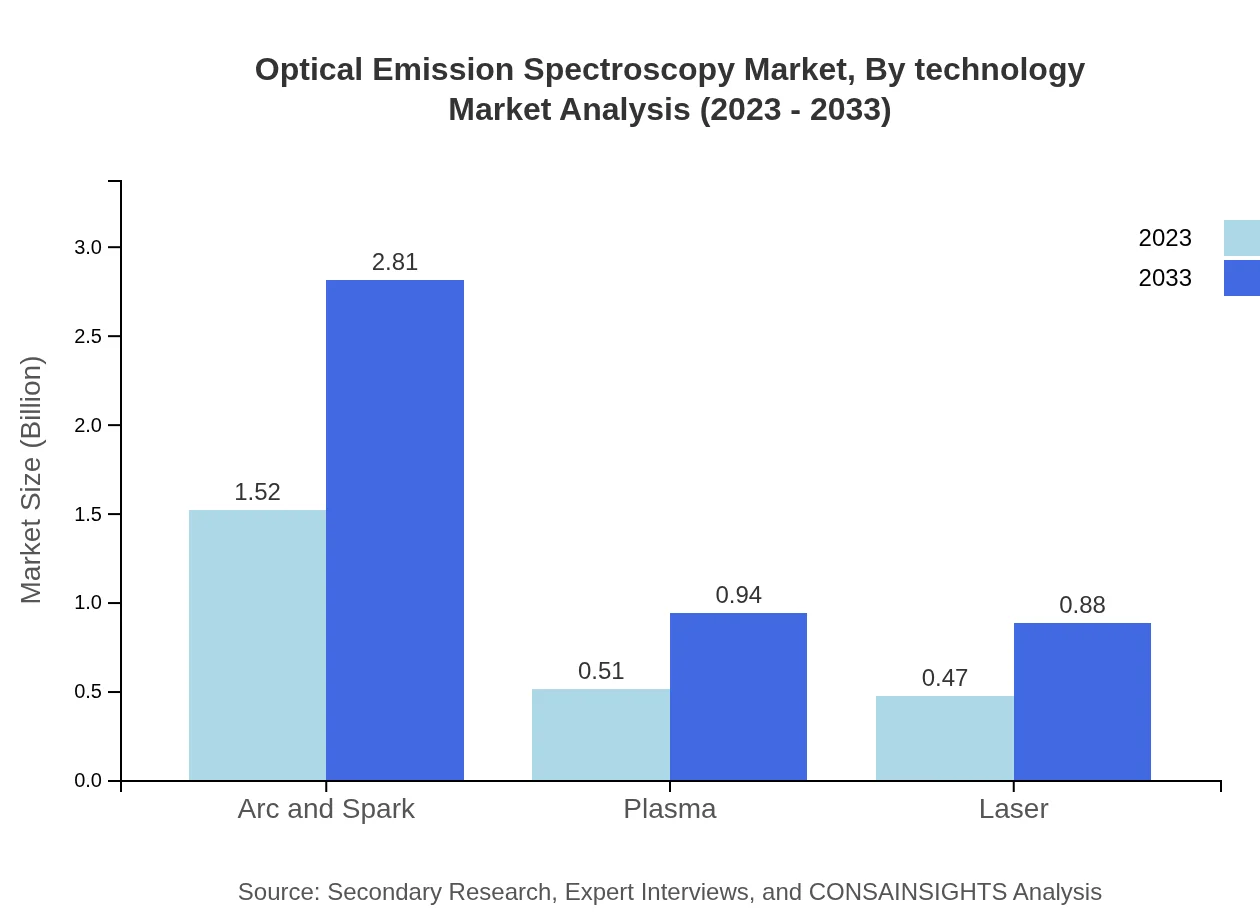
The technology segment includes Arc and Spark, Plasma, and Laser technologies. The Arc and Spark segment dominates the market with a share of 60.68% in 2023, which is expected to remain stable by 2033. Plasma and Laser technologies are also gaining traction, with shares of 20.32% and 19% respectively in 2023, both anticipated to grow through the forecast period.
Optical Emission Spectroscopy Market Analysis By Sample Type
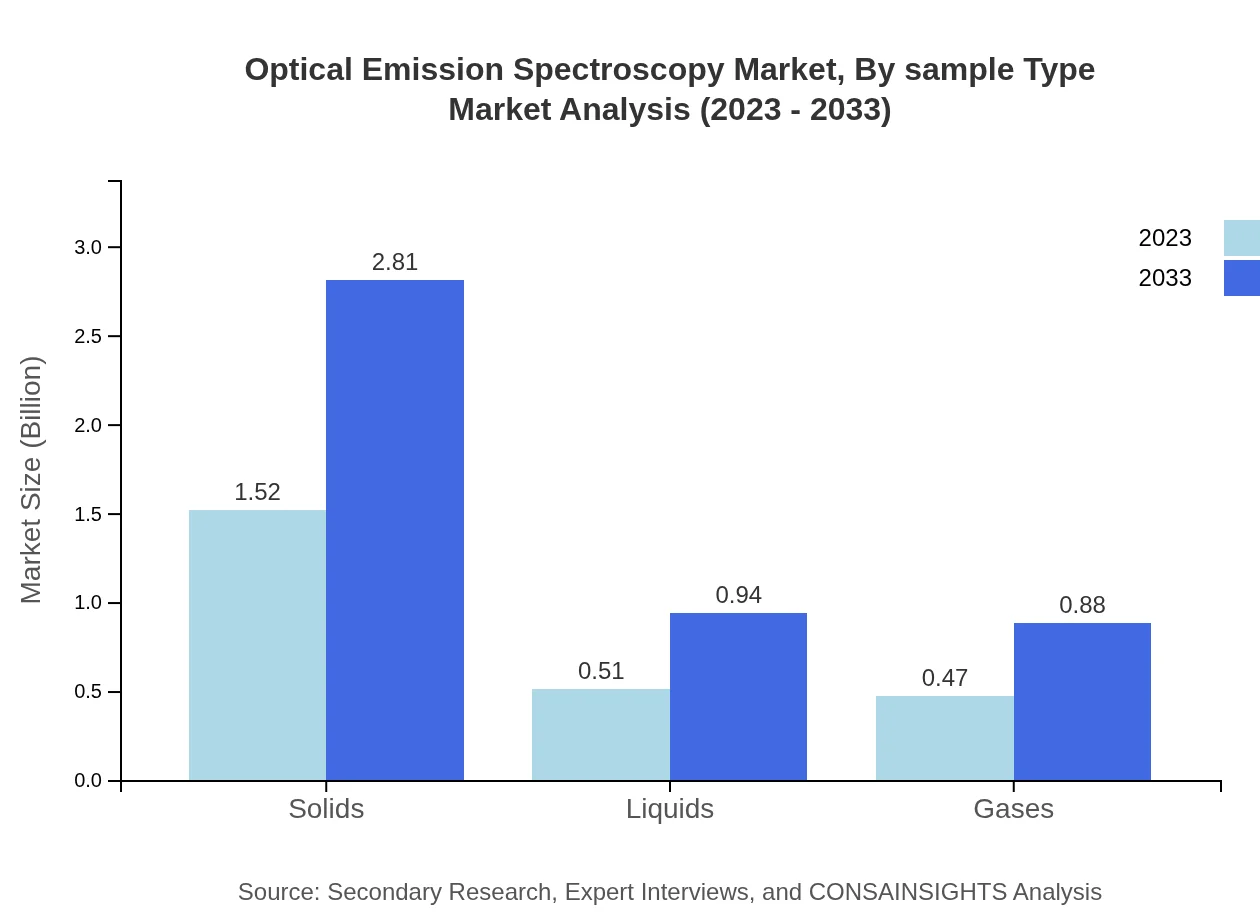
The sample type segmentation includes Solids, Liquids, and Gases. Solids lead the sample type market with 60.68% share in 2023, reflecting the industrial focus on solid materials in metallurgy and material science. Liquids and Gases comprise 20.32% and 19% respectively. The growth in this area is driven by the need for precise analysis in chemical processing and gas emissions.
Optical Emission Spectroscopy Market Analysis By End User
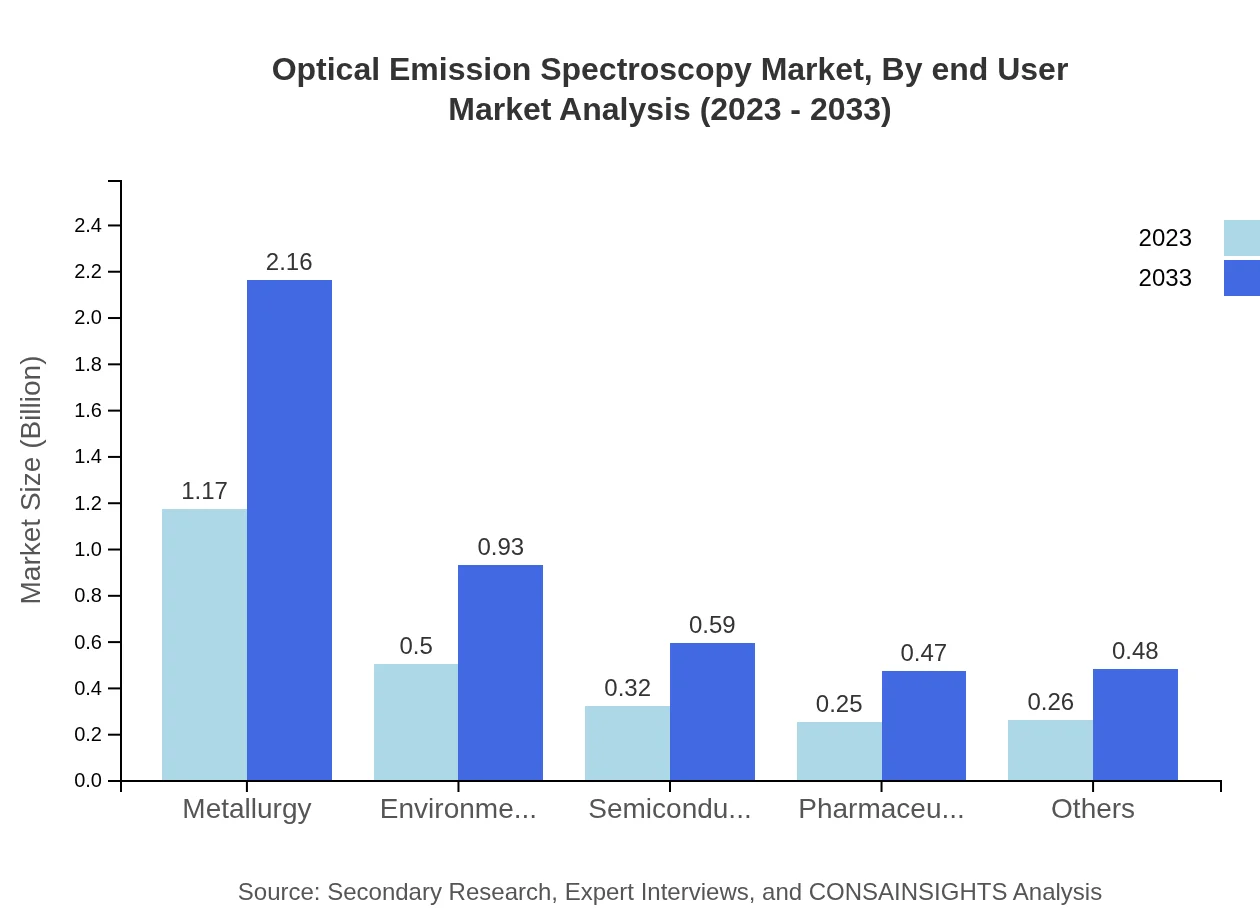
The end-user industries for OES include Metallurgy, Environmental, Semiconductors, Pharmaceuticals, and others. Metallurgy accounts for the largest share at 46.66%, demonstrating its relevance in quality and compositional analysis. Environmental testing also holds a significant share at 20.09%, driven by increasing environmental regulations around the globe.
Optical Emission Spectroscopy Market Analysis By Application
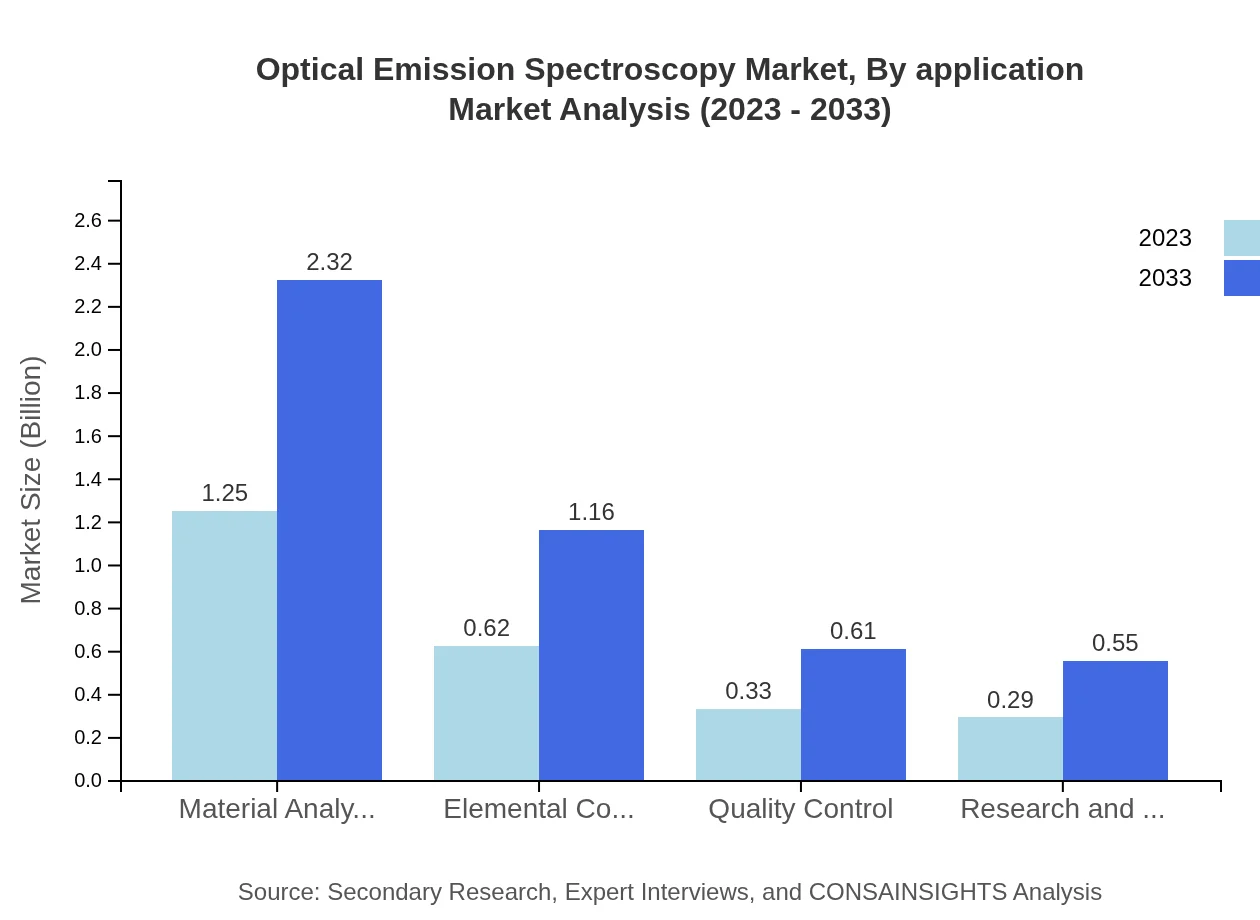
The market applications are predominantly in Material Analysis (50.05%), Elemental Composition (24.98%), and Quality Control (13.19%). Material Analysis remains crucial in identifying the physical properties of materials, while Elemental Composition analysis underpins various industrial processes ensuring quality and compliance.
Optical Emission Spectroscopy Market Trends and Future Forecast
Tell us your focus area and get a customized research report.
Global Market Leaders and Top Companies in Optical Emission Spectroscopy Industry
Thermo Fisher Scientific:
A leading player in the field, Thermo Fisher presents a wide range of analytical instruments, including OES solutions. The company is recognized for its commitment to innovation and quality.Agilent Technologies:
Agilent is known for its advanced analytical instruments and is a significant contributor to the OES market, focusing on high-performance solutions for various industrial applications.Horiba Scientific:
Horiba specializes in analytical and measuring instruments, playing a pivotal role in market growth with their advanced OES technologies aimed at diverse applications.PerkinElmer:
PerkinElmer provides complete analytical solutions, including OES, catering primarily to the pharmaceutical and environmental sectors.We're grateful to work with incredible clients.


FAQs
What is the market size of Optical Emission Spectroscopy?
The Optical Emission Spectroscopy market is valued at approximately $2.5 billion in 2023, with a projected compound annual growth rate (CAGR) of 6.2%. By 2033, the market size is expected to grow significantly, reflecting advancements and demand in various industries.
What are the key market players or companies in the Optical Emission Spectroscopy industry?
Key players in the Optical Emission Spectroscopy market include global leaders in analytical instrumentation, as well as specialized manufacturers providing innovative solutions. These companies are instrumental in driving market growth through product developments and strategic collaborations.
What are the primary factors driving the growth in the Optical Emission Spectroscopy industry?
The growth in the Optical Emission Spectroscopy industry is driven by increased demand for accurate material analysis, technological advancements, and rising applications in industries such as metallurgy, pharmaceuticals, and environmental monitoring.
Which region is the fastest Growing in the Optical Emission Spectroscopy market?
North America is currently the fastest-growing region in the Optical Emission Spectroscopy market, with its market size expanding from $0.89 billion in 2023 to an anticipated $1.64 billion by 2033, reflecting significant technological investments and applications.
Does ConsaInsights provide customized market report data for the Optical Emission Spectroscopy industry?
Yes, ConsaInsights offers customized market report data tailored to the specific needs of clients in the Optical Emission Spectroscopy industry. This service includes detailed insights and forecasts based on unique market conditions and customer requirements.
What deliverables can I expect from this Optical Emission Spectroscopy market research project?
From this market research project, clients can expect comprehensive deliverables including detailed market analysis, competitive landscape insights, regional market breakdown, and future growth projections tailored to the Optical Emission Spectroscopy sector.
What are the market trends of Optical Emission Spectroscopy?
Current market trends in Optical Emission Spectroscopy include increased application in sectors such as metallurgy and pharmaceuticals, a shift towards advanced spectroscopic techniques, and growing demand for real-time analysis in environmental monitoring.