
Patient Engagement Solutions Market Report
Published Date: 31 January 2026 | Report Code: patient-engagement-solutions
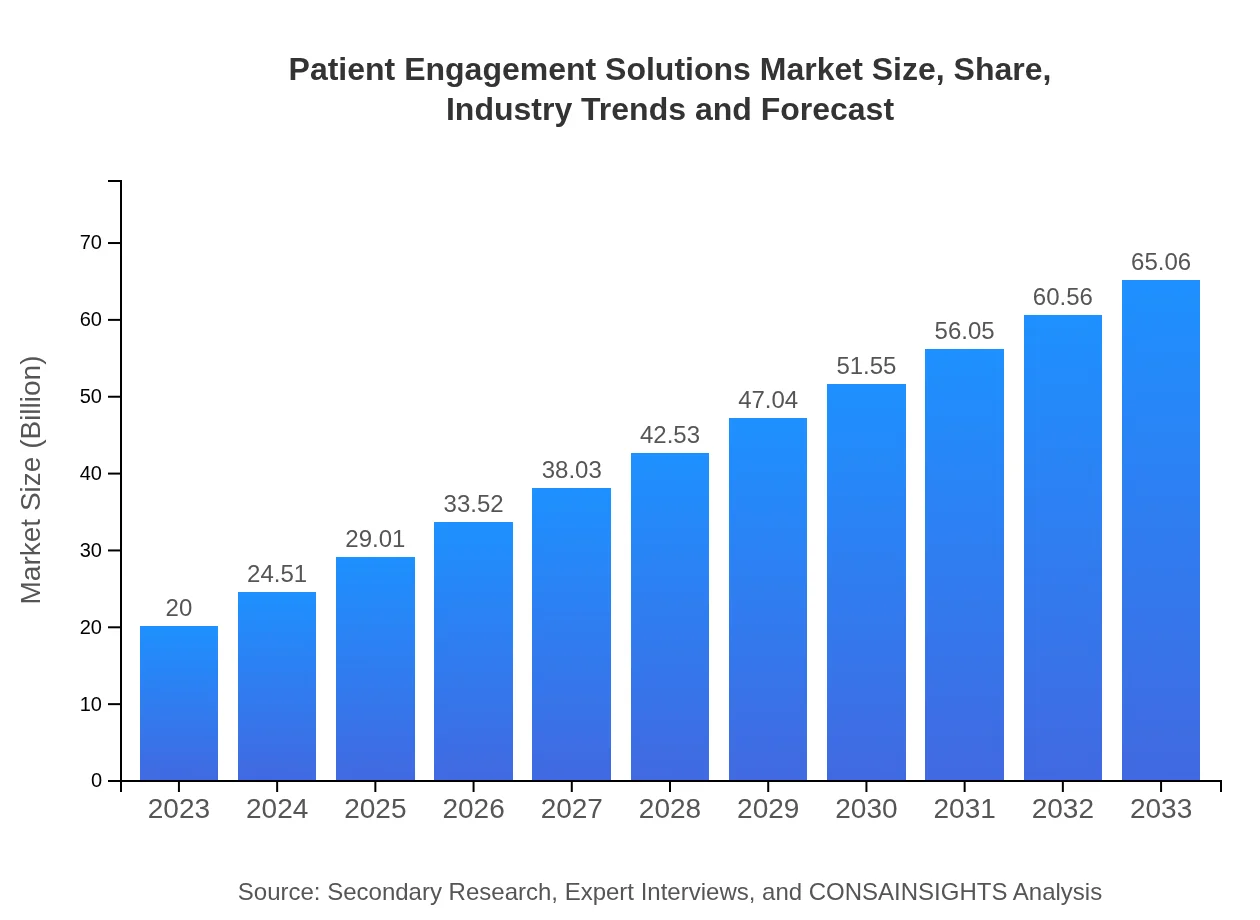
Patient Engagement Solutions Market Size, Share, Industry Trends and Forecast to 2033
This report examines the Patient Engagement Solutions market, including detailed insights into market size, growth forecasts, and trends through 2033. It aims to provide strategic information for stakeholders and decision-makers in the healthcare sector.
| Metric | Value |
|---|---|
| Study Period | 2023 - 2033 |
| 2023 Market Size | $20.00 Billion |
| CAGR (2023-2033) | 12% |
| 2033 Market Size | $65.06 Billion |
| Top Companies | Cerner Corporation, Epic Systems, Allscripts Healthcare Solutions, McKesson Corporation |
| Last Modified Date | 31 January 2026 |
Patient Engagement Solutions Market Overview
Customize Patient Engagement Solutions Market Report market research report
- ✔ Get in-depth analysis of Patient Engagement Solutions market size, growth, and forecasts.
- ✔ Understand Patient Engagement Solutions's regional dynamics and industry-specific trends.
- ✔ Identify potential applications, end-user demand, and growth segments in Patient Engagement Solutions
What is the Market Size & CAGR of Patient Engagement Solutions market in Year?
Patient Engagement Solutions Industry Analysis
Patient Engagement Solutions Market Segmentation and Scope
Tell us your focus area and get a customized research report.
Patient Engagement Solutions Market Analysis Report by Region
Europe Patient Engagement Solutions Market Report:
The European market is recognized for its regulatory support and technological innovations, projected to grow from $6.47 billion in 2023 to $21.06 billion by 2033. Countries are implementing comprehensive health IT solutions facilitating patient-centric approaches and improving health outcomes.Asia Pacific Patient Engagement Solutions Market Report:
In the Asia Pacific region, the Patient Engagement Solutions market was valued at $4.00 billion in 2023, with projections to reach approximately $13.02 billion by 2033. This growth is driven by increasing smartphone penetration and digital health initiatives by governments. The rising prevalence of chronic diseases and a young population are also catalyzing the adoption of engagement solutions.North America Patient Engagement Solutions Market Report:
North America leads the Patient Engagement Solutions market with a valuation of $6.47 billion in 2023 and projected growth to $21.05 billion by 2033. The high adoption of advanced technologies, supportive regulatory policies, and a focus on patient-centered care are significant drivers of this growth.South America Patient Engagement Solutions Market Report:
The South American market, valued at $1.30 billion in 2023, is expected to grow to $4.24 billion by 2033. Factors such as improving healthcare infrastructure and awareness about patient engagement are contributing to this growth. The region's unique challenges, such as regional disparities in healthcare access, emphasize the need for effective solutions.Middle East & Africa Patient Engagement Solutions Market Report:
In the Middle East and Africa, the market is expected to grow from $1.75 billion in 2023 to $5.69 billion by 2033. This growth is spurred by increasing healthcare expenditure and the implementation of digital health strategies aimed at enhancing patient experience.Tell us your focus area and get a customized research report.
Patient Engagement Solutions Market Analysis By Solution

The Patient Engagement Solutions market, segmented by solution types, reflects significant growth in digital channels, accounting for $16.17 billion in 2023 and expected to reach $52.59 billion by 2033. In-person channels will increase from $3.83 billion to $12.47 billion in the same period, signifying a shift towards more integrated engagement solutions.
Patient Engagement Solutions Market Analysis By Technology
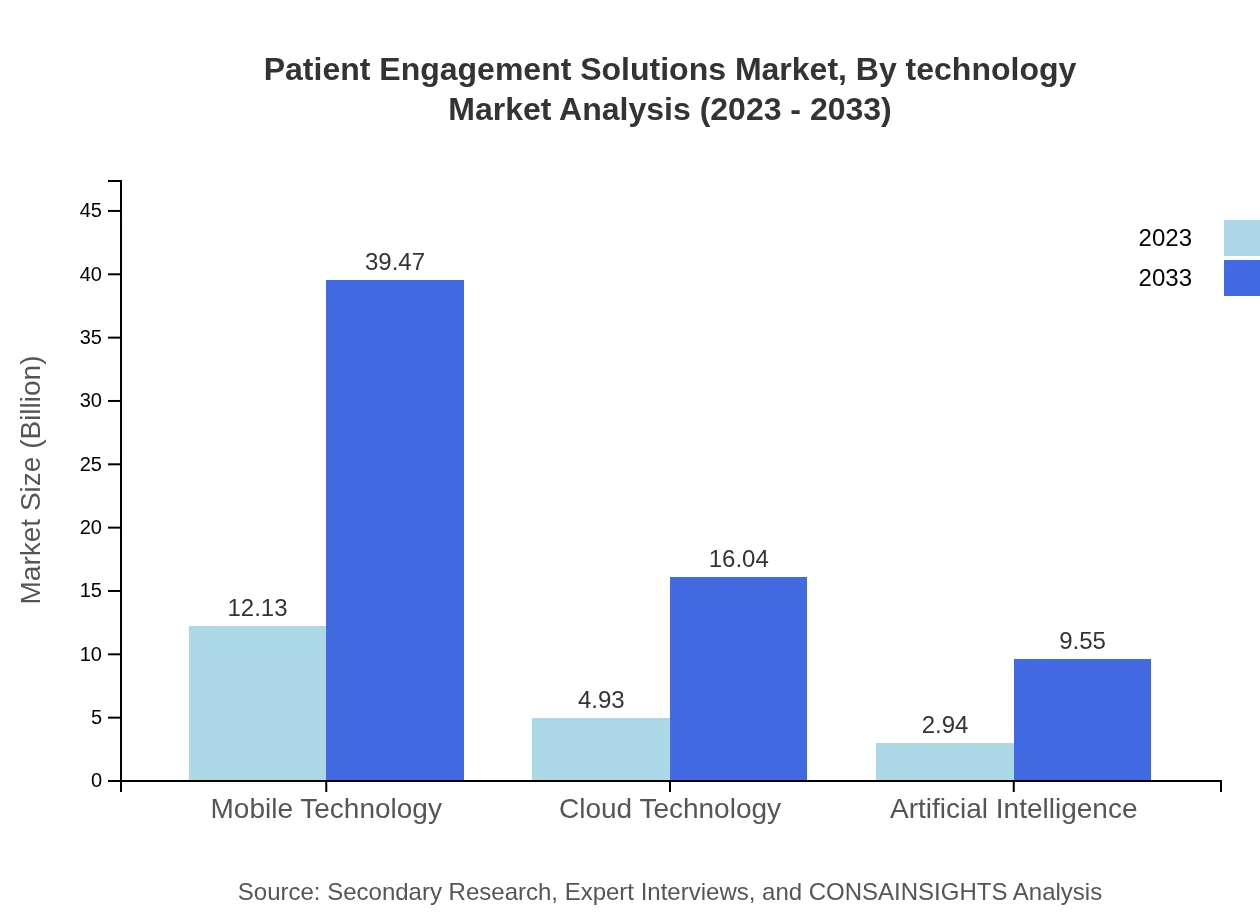
Technological advancements are pivotal in the Patient Engagement Solutions market. Mobile apps represent a substantial share in the technology segment, with a market size increasing from $12.13 billion in 2023 to $39.47 billion by 2033, driven by the demand for portable health monitoring solutions.
Patient Engagement Solutions Market Analysis By End User
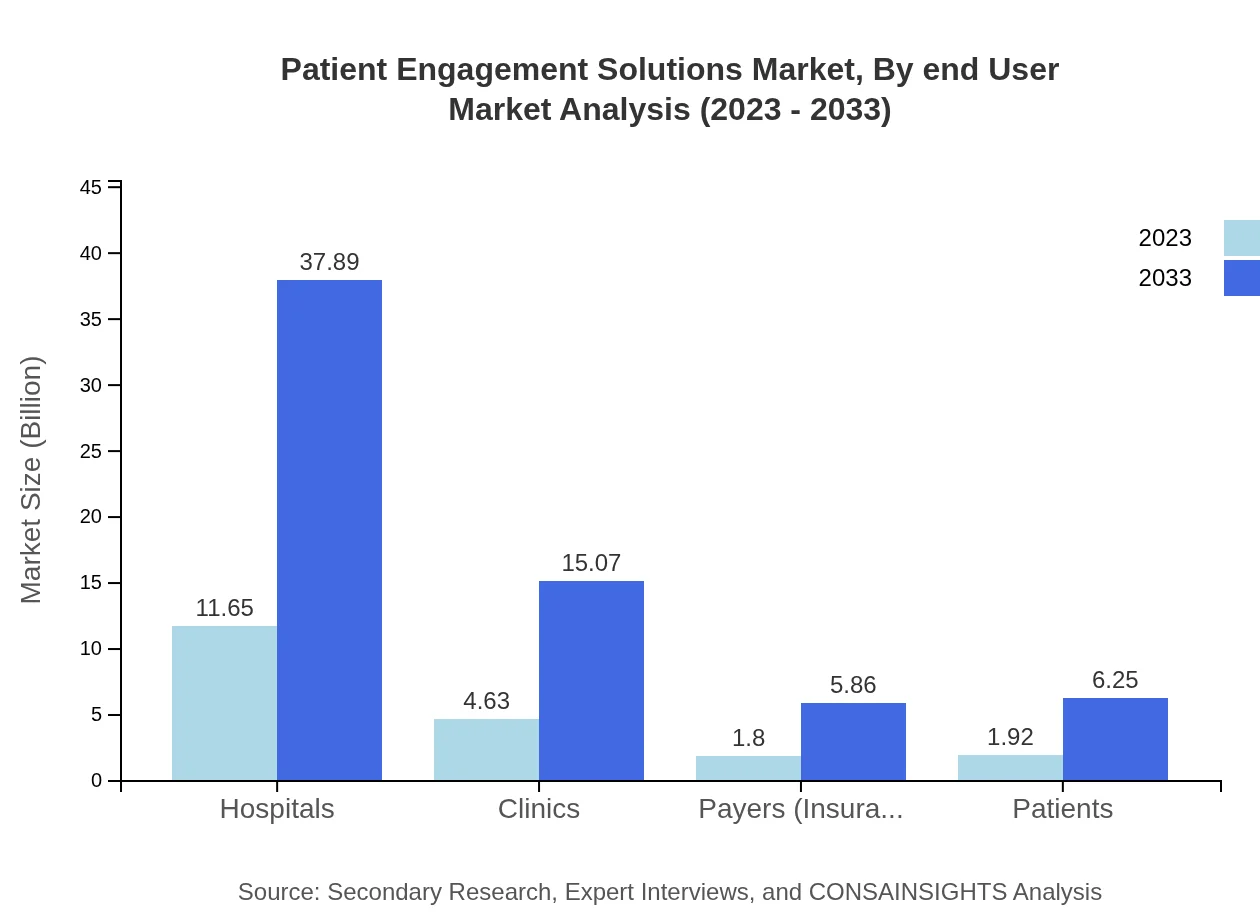
Analyzing the market by end-user, hospitals constitute a major segment, valued at $11.65 billion in 2023 and projected to grow to $37.89 billion by 2033. Clinics and payers will also see significant growth, from $4.63 to $15.07 billion, and $1.80 to $5.86 billion, respectively.
Patient Engagement Solutions Market Analysis By Channel
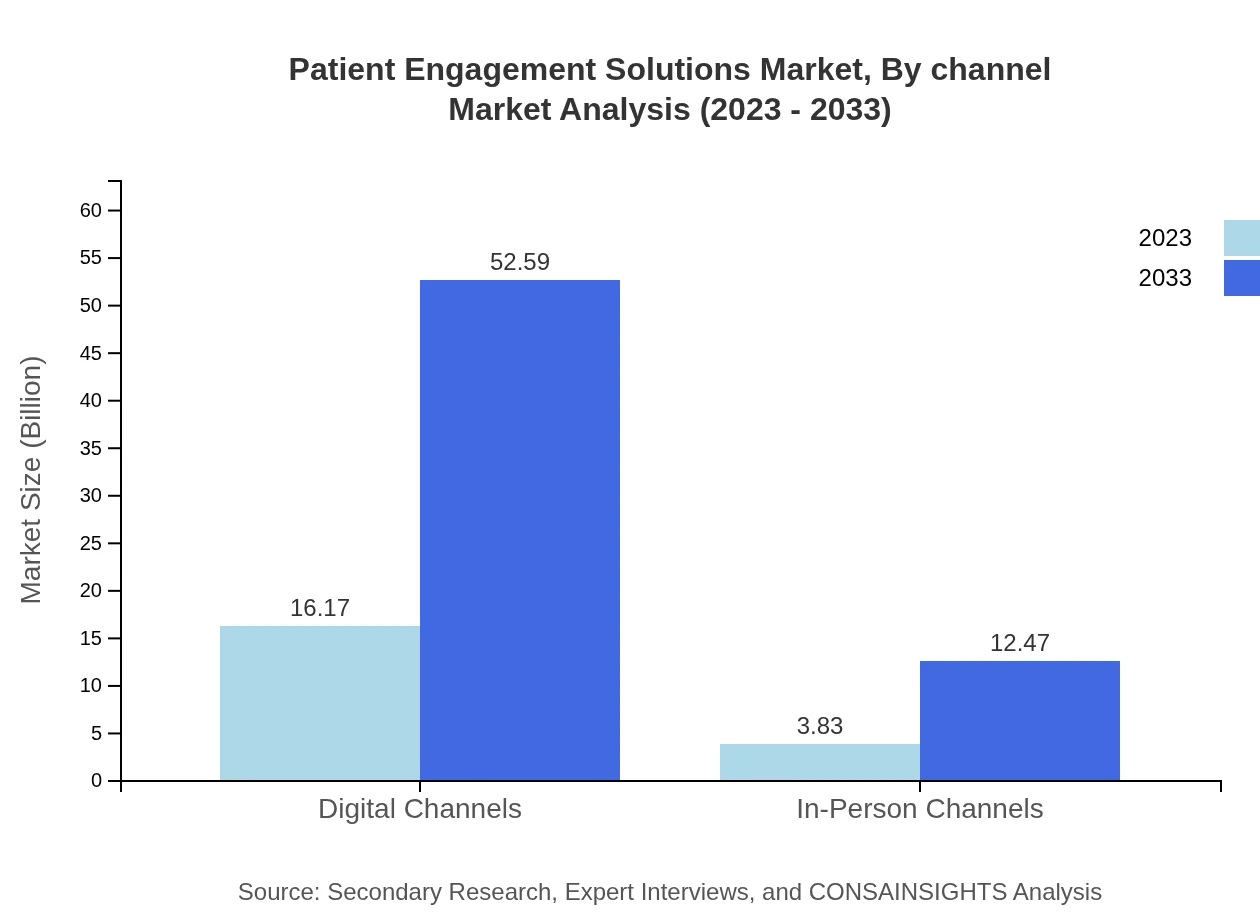
Market analysis by channel indicates that digital channels dominate with an 80.83% market share in 2023, expected to remain stable over the forecast years. In-person channels, while smaller, are projected to grow, reflecting the ongoing importance of traditional patient engagement methods.
Patient Engagement Solutions Market Trends and Future Forecast
Tell us your focus area and get a customized research report.
Global Market Leaders and Top Companies in Patient Engagement Solutions Industry
Cerner Corporation:
Cerner is a global leader in healthcare technology that provides innovative health engagement solutions, enhancing patient-provider communication and care quality.Epic Systems:
Epic Systems specializes in EHR software, supporting seamless patient engagement through advanced digital platforms, facilitating enhanced patient-centered care.Allscripts Healthcare Solutions:
Allscripts offers solutions designed to improve patient engagement and care coordination, enabling healthcare providers to deliver personalized experiences.McKesson Corporation:
McKesson is a prominent player in healthcare distribution and technology, providing patient engagement solutions that streamline processes and improve patient experiences.We're grateful to work with incredible clients.


FAQs
What is the market size of patient Engagement Solutions?
The global Patient Engagement Solutions market is valued at approximately $20 billion in 2023, with a projected Compound Annual Growth Rate (CAGR) of 12%. By 2033, the market is expected to grow significantly, reflecting increasing healthcare digitalization.
What are the key market players or companies in this patient Engagement Solutions industry?
Notable players in the Patient Engagement Solutions market include established healthcare technology firms and emerging startups. These companies focus on effectively enhancing patient interactions, offering solutions that range from mobile applications to advanced analytics tools, fostering improved healthcare delivery.
What are the primary factors driving the growth in the patient engagement solutions industry?
Key drivers of growth include the increasing adoption of digital healthcare solutions, rising consumer demand for personalized healthcare experiences, and the necessity to comply with regulatory mandates. Innovations in mobile technology and data analytics are also significantly contributing to market expansion.
Which region is the fastest Growing in the patient engagement solutions market?
The Asia Pacific region is poised to be the fastest-growing market for Patient Engagement Solutions, expanding from $4 billion in 2023 to $13 billion by 2033. Its rapid growth is driven by technological advancements and increasing healthcare investments.
Does ConsaInsights provide customized market report data for the patient engagement solutions industry?
Yes, ConsaInsights offers customized market report data specifically tailored to the needs of the Patient Engagement Solutions industry. Clients can request focused analysis that fits their specific requirements, enhancing their strategic decision-making.
What deliverables can I expect from this patient engagement solutions market research project?
Deliverables from the patient engagement solutions market research project typically include detailed reports, market forecasts, competitor analysis, and insights into consumer trends. Tables and charts illustrating market data and growth projections are also common components.
What are the market trends of patient engagement solutions?
Key trends include the shift towards digital channels for patient communication, with digital channels expected to represent 81% market share by 2033. Additionally, the integration of advanced technologies, such as AI and mobile apps, is transforming patient engagement dynamics.