
Powered Gates Market Report
Published Date: 02 February 2026 | Report Code: powered-gates
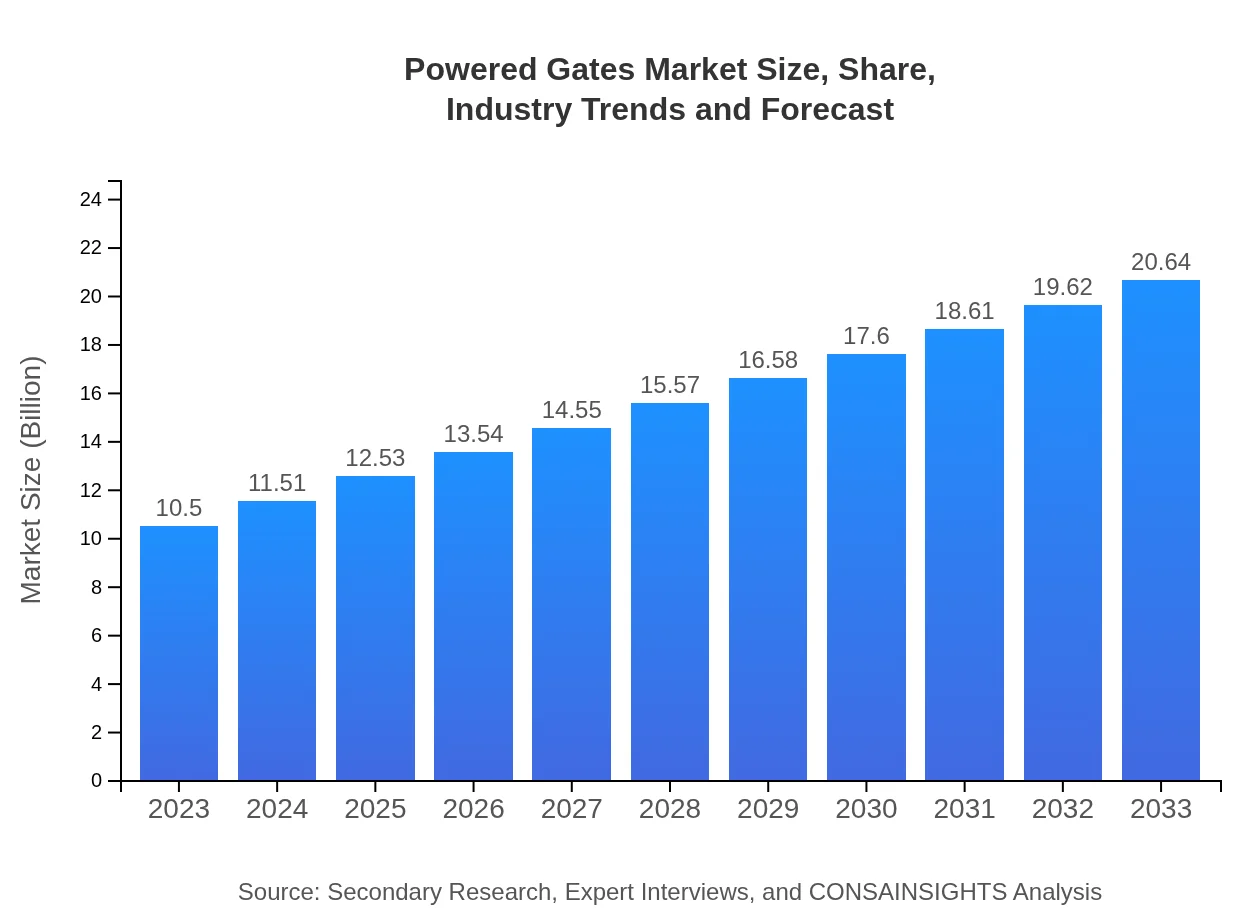
Powered Gates Market — USD 10.5 billion in 2023, Growing to USD 20.64B by 2033 at 6.8% CAGR
This report provides an in-depth analysis of the Powered Gates market from 2023 to 2033, offering insights into market size, trends, segmentation, regional analysis, and major players in the industry.
| Metric | Value |
|---|---|
| Study Period | 2023 - 2033 |
| 2023 Market Size | $10.50 Billion |
| CAGR (2023-2033) | 6.8% |
| 2033 Market Size | $20.64 Billion |
| Top Companies | LiftMaster, BFT, FAAC, Beninca, CAME |
| Last Modified Date | 02 February 2026 |
Powered Gates Market Overview
Customize Powered Gates Market Report market research report
- ✔ Get in-depth analysis of Powered Gates market size, growth, and forecasts.
- ✔ Understand Powered Gates's regional dynamics and industry-specific trends.
- ✔ Identify potential applications, end-user demand, and growth segments in Powered Gates
What is the Market Size & CAGR of Powered Gates market in 2023?
Powered Gates Industry Analysis
Powered Gates Market Segmentation and Scope
Tell us your focus area and get a customized research report.
Powered Gates Market Analysis Report by Region
Europe Powered Gates Market Report:
Europe's Powered Gates market is valued at $3.34 billion in 2023 and is projected to grow to $6.56 billion by 2033. The region benefits from stringent safety regulations and a growing trend towards automated infrastructure.Asia Pacific Powered Gates Market Report:
In 2023, the Asia Pacific region is valued at $1.97 billion and is projected to reach $3.88 billion by 2033. This growth is stimulated by rapid urbanization, increasing disposable incomes, and the growing residential and commercial sectors in countries like China and India.North America Powered Gates Market Report:
North America’s Powered Gates market is estimated at $3.62 billion in 2023, anticipating an increase to $7.12 billion by 2033. The robust growth is fueled by the high adoption rates of smart technologies and heightened demand for residential and commercial security solutions.South America Powered Gates Market Report:
The South American market for Powered Gates was valued at $0.89 billion in 2023, expected to grow to $1.75 billion by 2033. Factors contributing to this growth include rising security concerns and urban development projects across major cities.Middle East & Africa Powered Gates Market Report:
The Powered Gates market in the Middle East and Africa is currently valued at $0.67 billion in 2023 and is expected to double to $1.32 billion by 2033, driven by increasing investment in infrastructure and the necessity for enhanced security in urban areas.Tell us your focus area and get a customized research report.
Powered Gates Market Analysis By Type
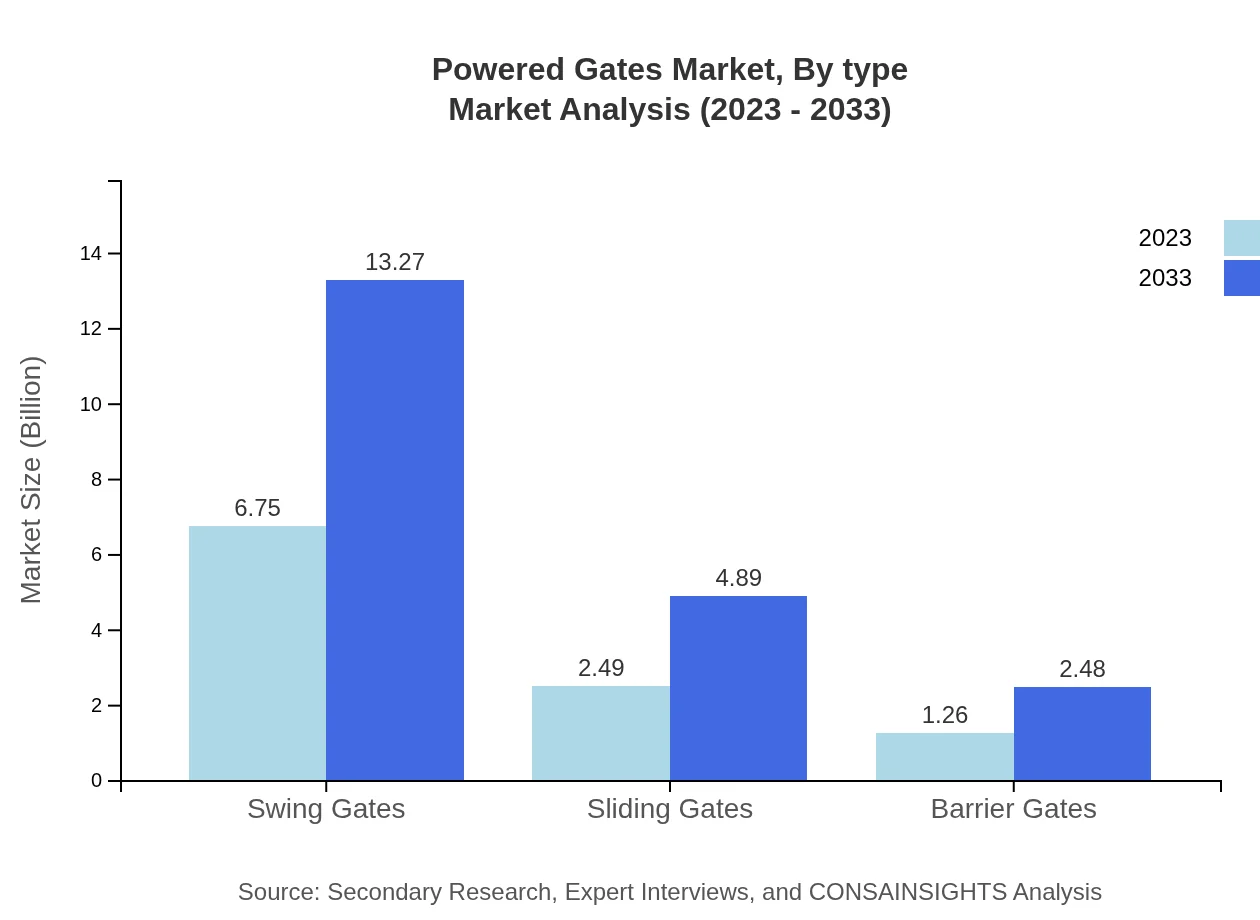
The market differentiates primarily into swing gates, sliding gates, and barrier gates. Swing gates hold a major market share at 64.28%, valued at $6.75 billion in 2023, and expected to rise to $13.27 billion by 2033. Sliding gates generate $2.49 billion in 2023, accounting for 23.69% share, projected to grow to $4.89 billion by 2033. Barrier gates represent 12.03% share with a market size of $1.26 billion in 2023, growing to $2.48 billion by 2033.
Powered Gates Market Analysis By Technology

The powered gates market is categorized based on technology into electrical, solar, and hydraulic powered gates. Electrical powered gates dominate the market with a share of 64.28%, valued at $6.75 billion in 2023, projected to reach $13.27 billion by 2033. Solar powered gates account for 23.69% of the market, worth $2.49 billion in 2023 and anticipated to grow to $4.89 billion by 2033. Hydraulic powered gates possess a market share of 12.03%, with sizes expanding from $1.26 billion to $2.48 billion in the same period.
Powered Gates Market Analysis By End User
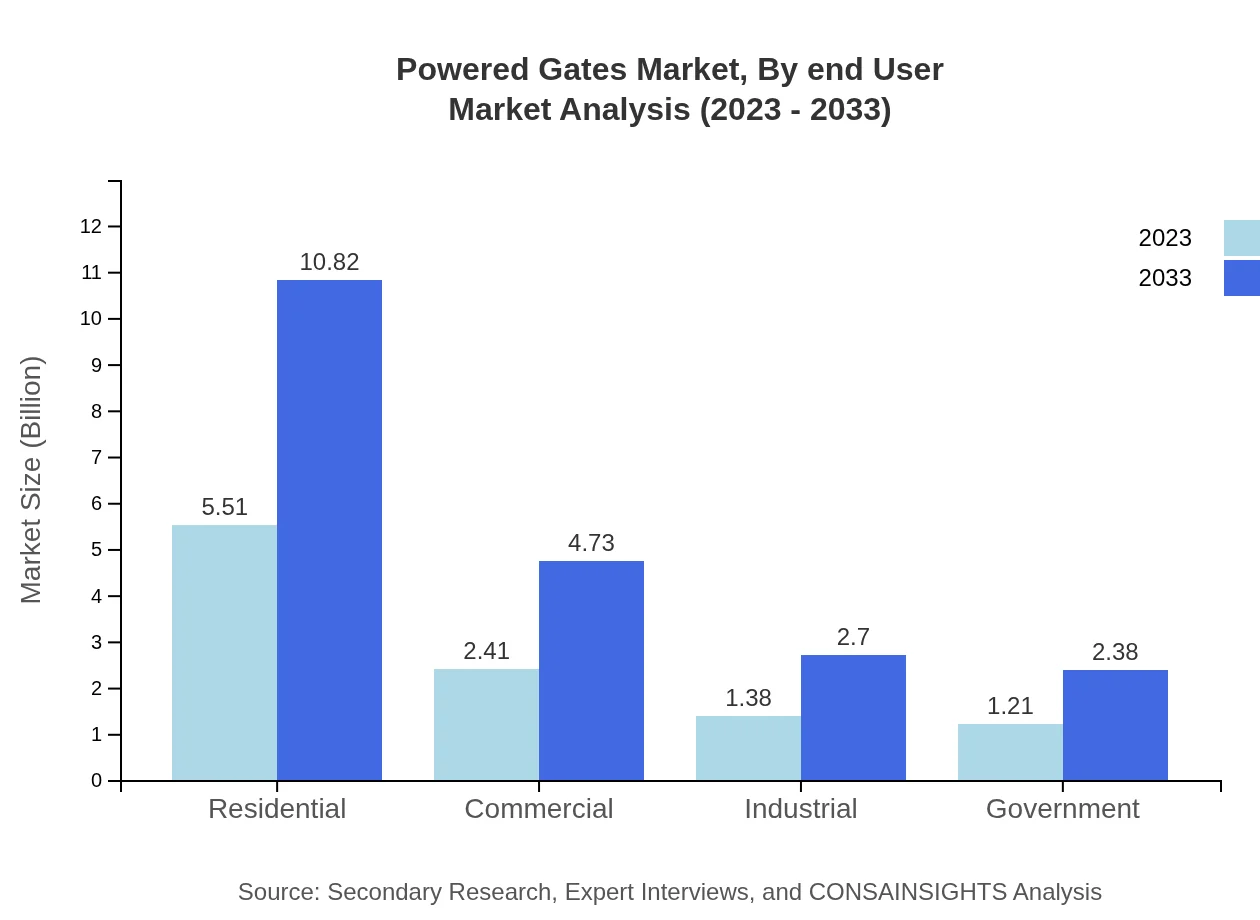
Residential applications lead the market, holding a 52.44% share, generating $5.51 billion in 2023, with a forecast to grow to $10.82 billion by 2033. Commercial and industrial sectors account for 22.93% and 13.1% of the market, respectively, while government entities contribute 11.53% share, with sizes growing from $1.21 billion to $2.38 billion throughout the forecast period.
Powered Gates Market Analysis By Application

In applications, powered gates serve security and access control requirements. Security applications dominate with a market size of $6.75 billion in 2023, projected to increase to $13.27 billion by 2033. Access control applications follow with $2.49 billion in size, growing to $4.89 billion, while traffic management applications are smaller, worth $1.26 billion now, and growing to $2.48 billion.
Powered Gates Market Analysis By Installation
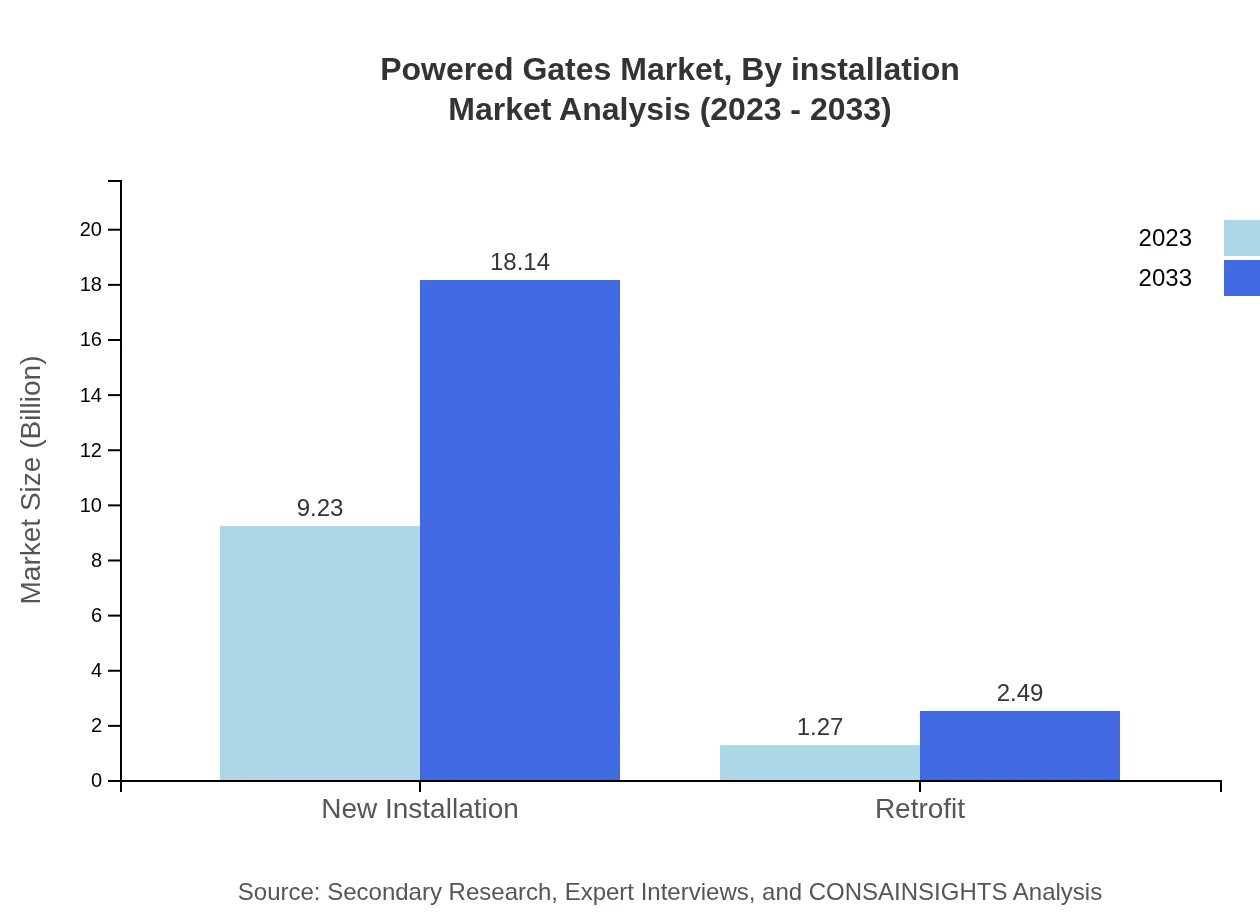
New installations make up 87.92% of the powered gates market, currently generating $9.23 billion in 2023 and expected to reach $18.14 billion by 2033. Retrofit installations, though smaller, contribute at 12.08%, growing from $1.27 billion to $2.49 billion, indicating a changing landscape towards upgrading existing systems.
Powered Gates Market Trends and Future Forecast
Tell us your focus area and get a customized research report.
Global Market Leaders and Top Companies in Powered Gates Industry
LiftMaster:
A leader in residential and commercial gate operators, LiftMaster focuses on smart home technology to enhance security and convenience.BFT:
BFT specializes in automated gate systems, offering a wide variety of solutions for access control and security applications.FAAC:
FAAC is renowned for its automation products in gate operators, delivering innovations that cater to the evolving demands of smart technologies.Beninca:
Beninca produces high-quality automatic gates and access control solutions, recognized for their engineering excellence and reliability.CAME:
CAME is a key player in the powered gates market, providing advanced automation systems that focus on efficiency and user-friendliness.We're grateful to work with incredible clients.


FAQs
What is the market size of powered gates?
The powered gates market is valued at approximately $10.5 billion in 2023, with an expected CAGR of 6.8% through to 2033. This growth reflects increasing adoption across residential and commercial applications, demonstrating robust market demand.
What are the key market players or companies in this powered gates industry?
Key players in the powered gates industry include major manufacturers like Chamberlain Group, Hormann Group, and FAAC S.p.A. These companies lead due to their innovative solutions and extensive market reach, catering to various customer segments.
What are the primary factors driving the growth in the powered gates industry?
Growth in the powered gates industry is driven by rising security needs, technological advancements in automation, and increased urbanization. The shift towards residential automation and smart home technologies is also propelling demand significantly.
Which region is the fastest Growing in the powered gates?
Asia Pacific is the fastest-growing region in the powered gates market, expecting a rise from $1.97 billion in 2023 to $3.88 billion by 2033. This growth is attributed to rapid industrialization and increasing investments in infrastructure.
Does ConsaInsights provide customized market report data for the powered gates industry?
Yes, ConsaInsights offers customized market report data specifically tailored to the powered gates industry, accommodating unique business needs and market insights. This service ensures relevant data is provided to support strategic decisions.
What deliverables can I expect from this powered gates market research project?
Deliverables from the powered gates market research project include comprehensive market analysis reports, segment performance metrics, competitor insights, and tailored recommendations, all aimed at enhancing strategic business decisions.
What are the market trends of powered gates?
Current trends in the powered gates market include the rising adoption of solar-powered solutions, innovative access control technologies, and growth in smart security systems. These trends indicate a shift towards more efficient and automated gate solutions.