
Printed Thin Film Battery Market Report
Published Date: 31 January 2026 | Report Code: printed-thin-film-battery
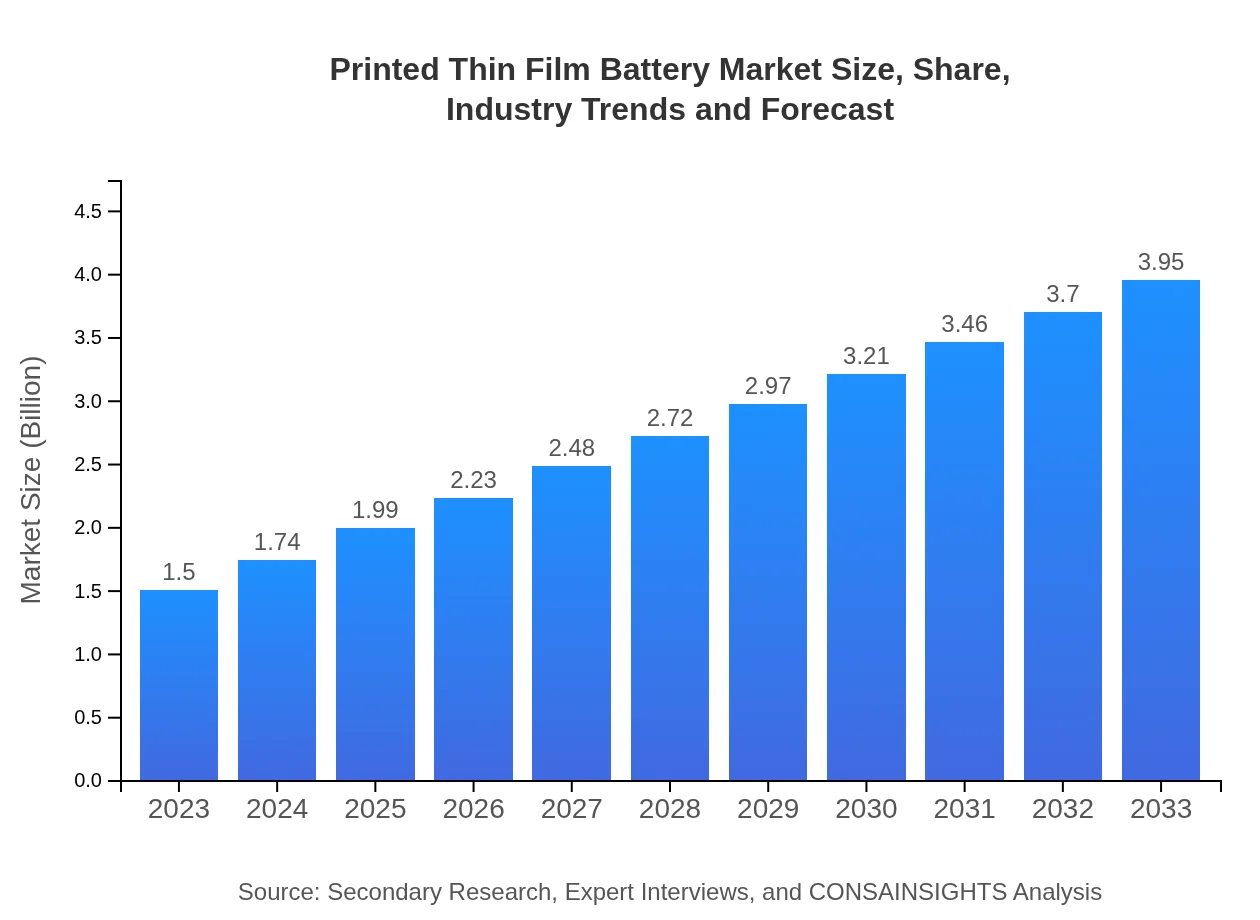
Printed Thin Film Battery Market Size, Share, Industry Trends and Forecast to 2033
This report provides an in-depth analysis of the Printed Thin Film Battery market from 2023 to 2033, covering market size, growth trends, segmentation, regional insights, and leading companies in the industry.
| Metric | Value |
|---|---|
| Study Period | 2023 - 2033 |
| 2023 Market Size | $1.50 Billion |
| CAGR (2023-2033) | 9.8% |
| 2033 Market Size | $3.95 Billion |
| Top Companies | Apple Inc., Samsung SDI, STMicroelectronics, Blue Solutions |
| Last Modified Date | 31 January 2026 |
Printed Thin Film Battery Market Overview
Customize Printed Thin Film Battery Market Report market research report
- ✔ Get in-depth analysis of Printed Thin Film Battery market size, growth, and forecasts.
- ✔ Understand Printed Thin Film Battery's regional dynamics and industry-specific trends.
- ✔ Identify potential applications, end-user demand, and growth segments in Printed Thin Film Battery
What is the Market Size & CAGR of Printed Thin Film Battery market in 2023?
Printed Thin Film Battery Industry Analysis
Printed Thin Film Battery Market Segmentation and Scope
Tell us your focus area and get a customized research report.
Printed Thin Film Battery Market Analysis Report by Region
Europe Printed Thin Film Battery Market Report:
The European market is set to grow from USD 0.40 billion in 2023 to USD 1.06 billion by 2033, owing to an emphasis on renewable energy, and European regulations favoring lightweight and eco-friendly battery technologies.Asia Pacific Printed Thin Film Battery Market Report:
In the Asia Pacific region, the Printed Thin Film Battery market is expected to grow from USD 0.31 billion in 2023 to USD 0.80 billion by 2033, highlighting a significant CAGR fueled by the booming electronics manufacturing sector.North America Printed Thin Film Battery Market Report:
North America is projected to witness growth from USD 0.48 billion in 2023 to USD 1.27 billion by 2033, supported by advances in medical technology and sustainable energy solutions.South America Printed Thin Film Battery Market Report:
South America's market is expected to rise from USD 0.11 billion in 2023 to USD 0.28 billion by 2033, driven primarily by increasing demand for portable medical devices and consumer electronics.Middle East & Africa Printed Thin Film Battery Market Report:
In the Middle East and Africa, the market is expected to increase from USD 0.20 billion in 2023 to USD 0.53 billion by 2033, as demand for innovative energy solutions rises across various sectors.Tell us your focus area and get a customized research report.
Printed Thin Film Battery Market Analysis By Type
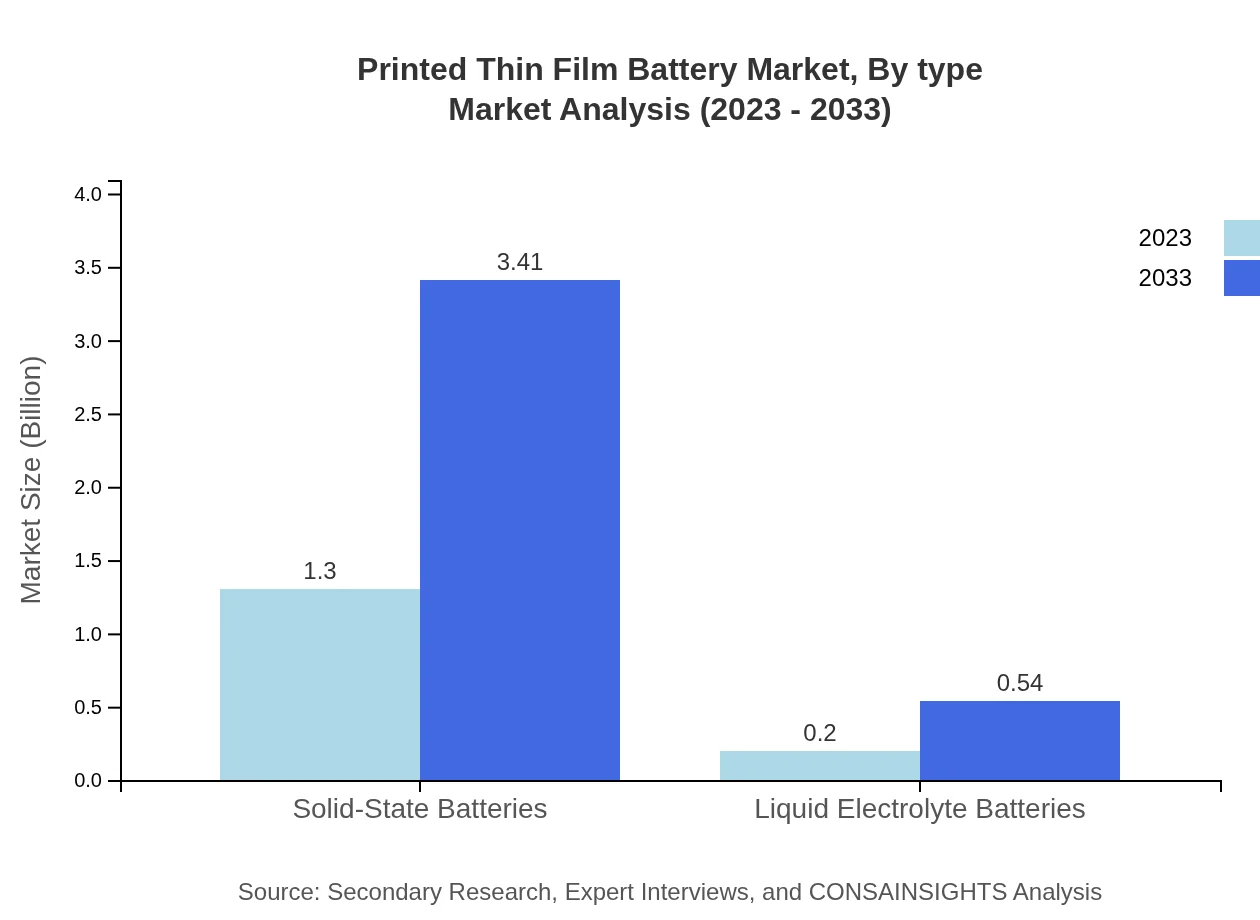
The type segment shows strong performance for solid-state batteries, which will grow from USD 1.30 billion in 2023 to USD 3.41 billion by 2033, accounting for 86.35% of the market share. Liquid electrolyte batteries, while smaller, are also expected to grow, from USD 0.20 billion to USD 0.54 billion, capturing 13.65% of the market.
Printed Thin Film Battery Market Analysis By Application
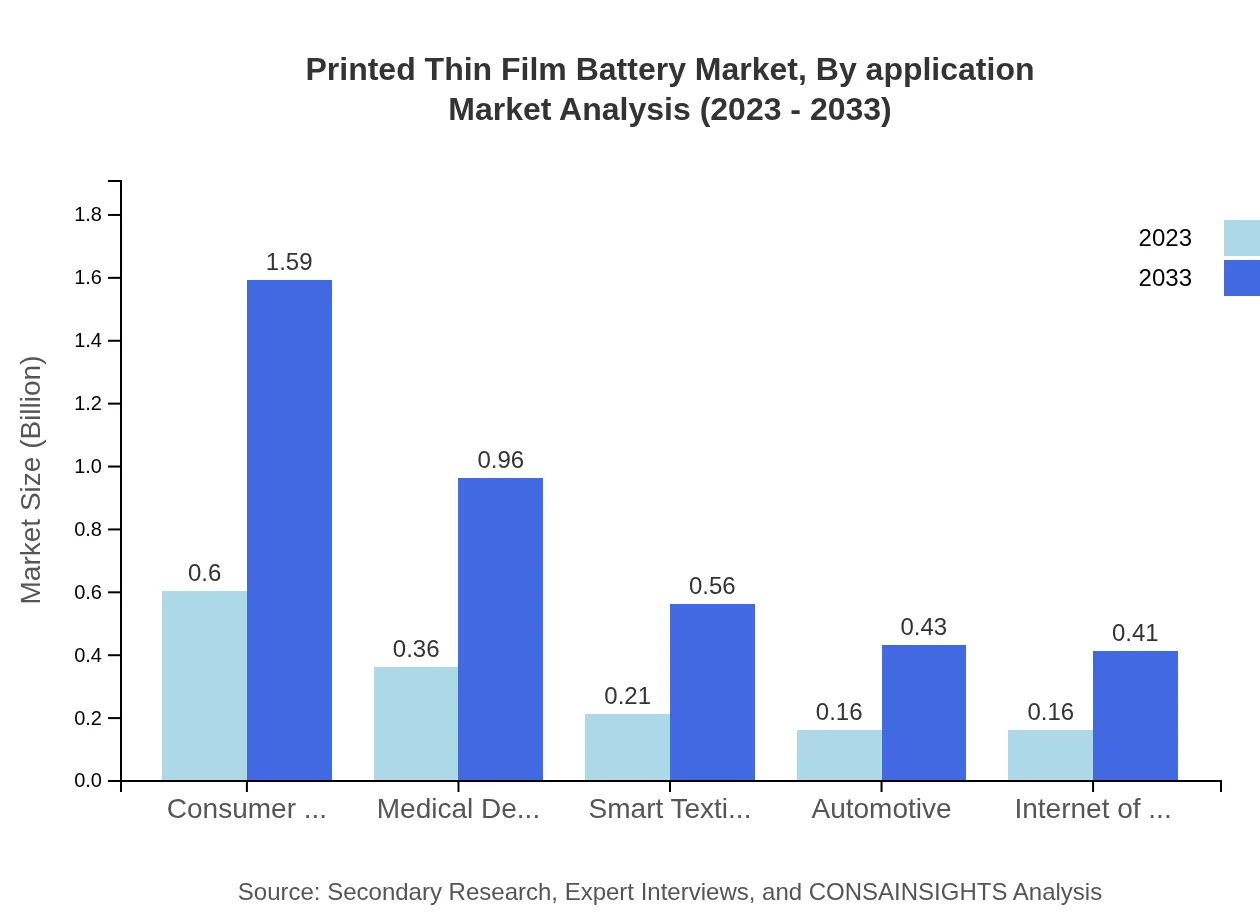
In terms of applications, consumer electronics lead with a market size increase from USD 0.60 billion in 2023 to USD 1.59 billion by 2033, holding approximately 40.21% of the market share. Medical devices follow, growing from USD 0.36 billion to USD 0.96 billion with a share of 24.27%.
Printed Thin Film Battery Market Analysis By Manufacturing Technique
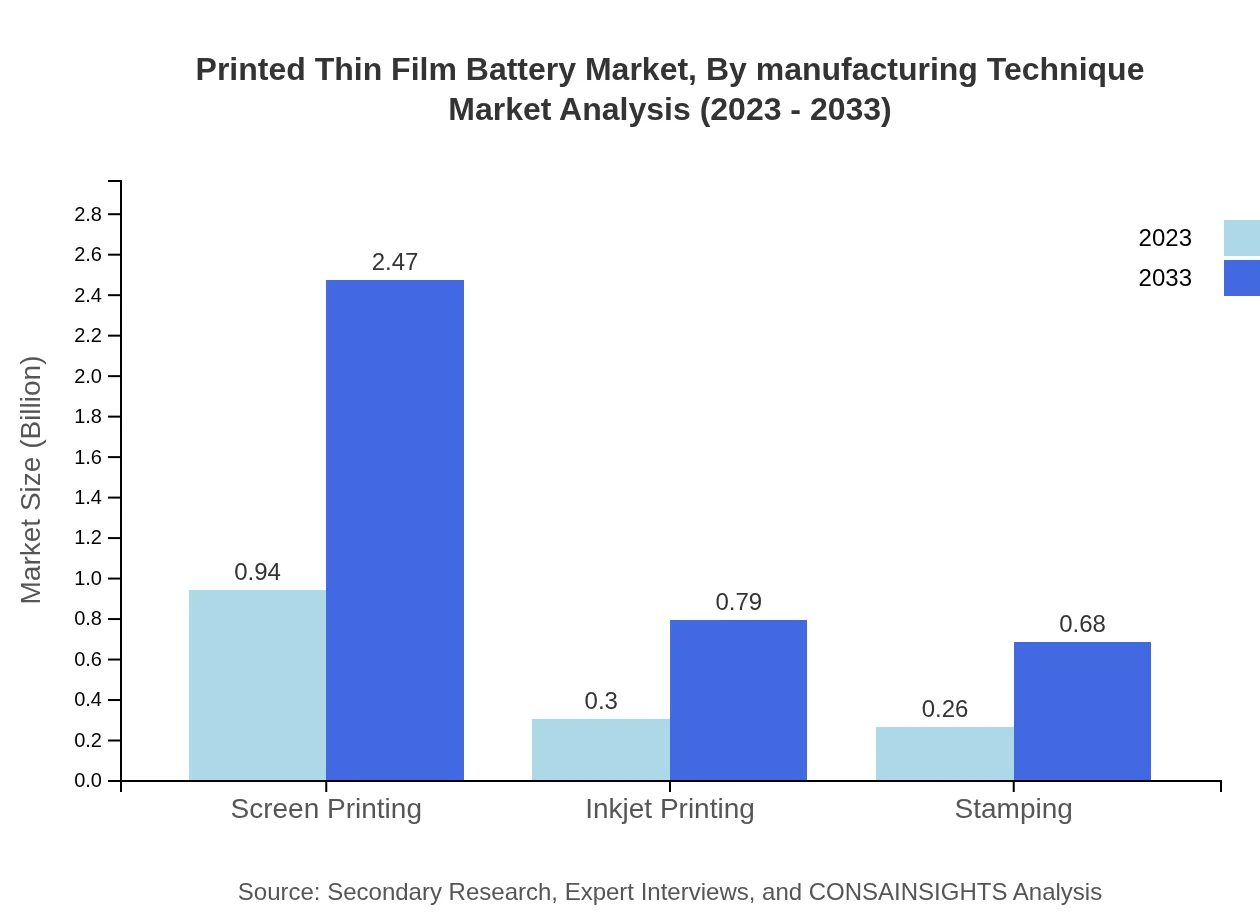
Screen printing dominates this segment with a market increase from USD 0.94 billion in 2023 to USD 2.47 billion by 2033, holding a share of 62.62%. Inkjet printing and stamping methods also exhibit growth, with shares of 20.06% and 17.32%, respectively, indicating diversification in manufacturing approaches.
Printed Thin Film Battery Market Analysis By Distribution Channel
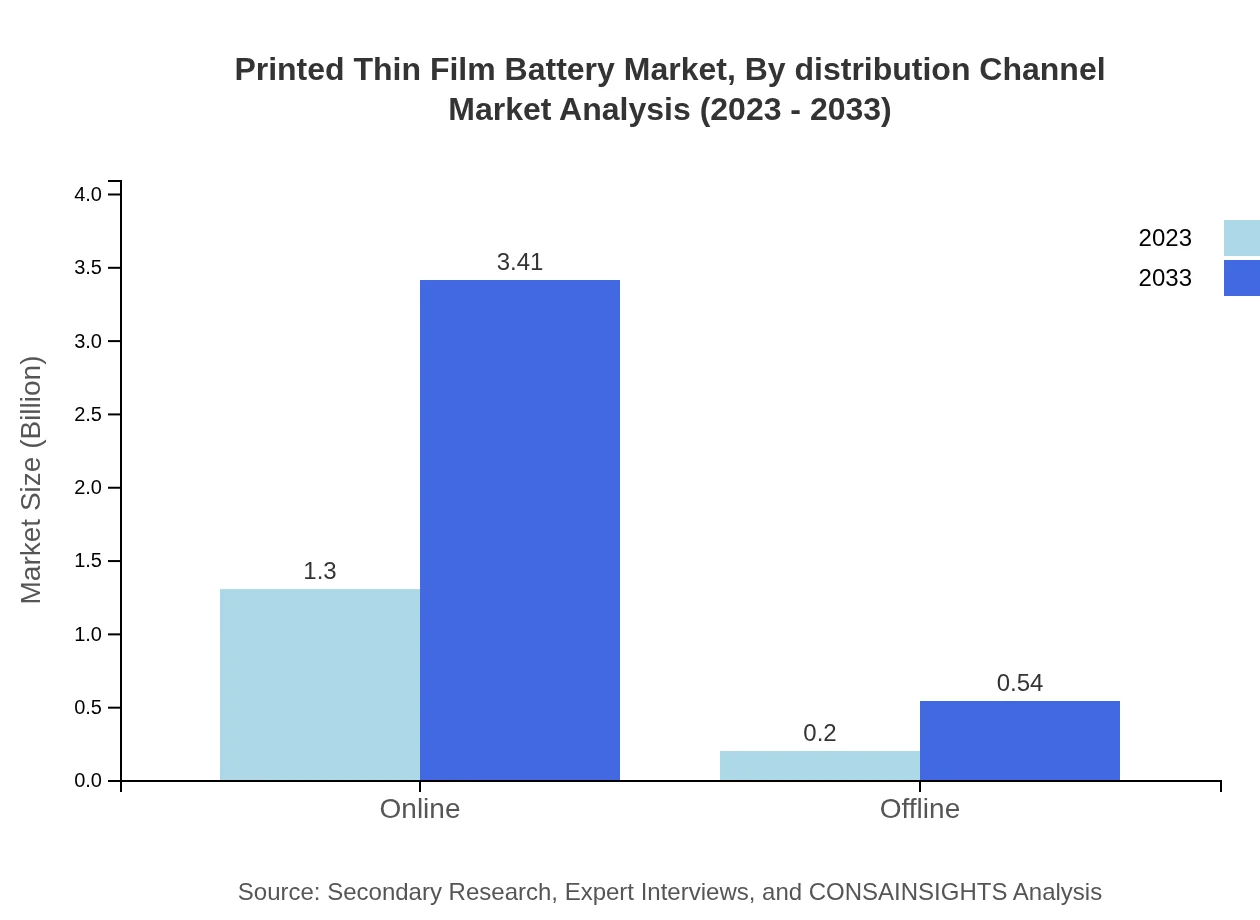
The distribution channel segment presents two main avenues, with online sales leading at USD 1.30 billion in 2023, expected to rise to USD 3.41 billion by 2033. Offline sales also show incremental growth from USD 0.20 billion to USD 0.54 billion, demonstrating the importance of multi-channel strategies.
Printed Thin Film Battery Market Analysis By Material
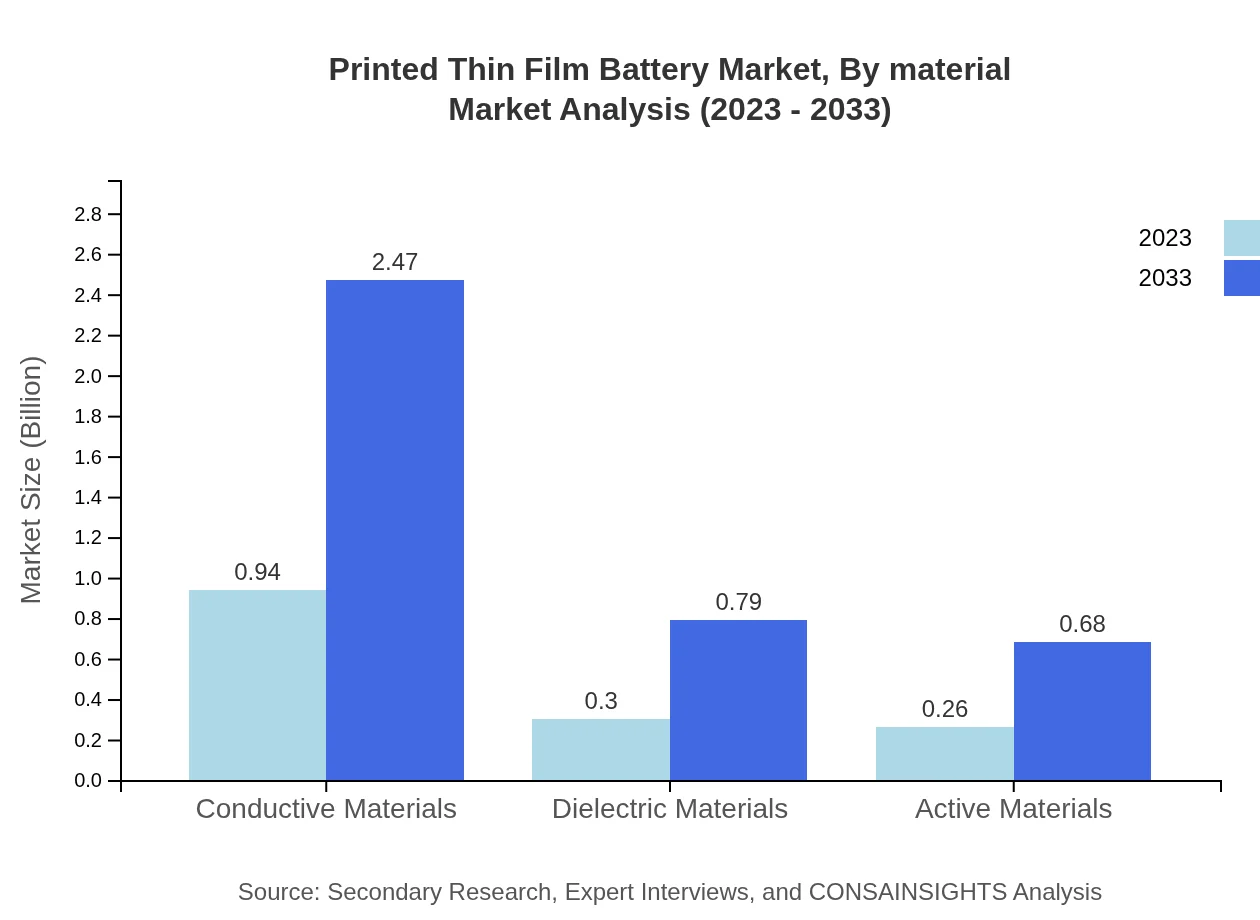
The market for conductive materials remains significant, projected to grow from USD 0.94 billion in 2023 to USD 2.47 billion by 2033, representing 62.62% of total material expenditure. This is complemented by dielectric materials and active materials, accounting for 20.06% and 17.32% respectively.
Printed Thin Film Battery Market Trends and Future Forecast
Tell us your focus area and get a customized research report.
Global Market Leaders and Top Companies in Printed Thin Film Battery Industry
Apple Inc.:
Apple Inc. plays a significant role in the development of Printed Thin Film Battery technology, focusing on lightweight and efficient batteries for its devices.Samsung SDI:
Samsung SDI specializes in battery technology and has made major investments in research and development to enhance thin film batteries for consumer electronics.STMicroelectronics:
STMicroelectronics offers advanced technology solutions in the Printed Thin Film Battery space, focusing on sustainable and efficient energy storage solutions.Blue Solutions:
Blue Solutions is a leading company in solid-state thin film battery technology, pushing innovations in energy density and battery longevity.We're grateful to work with incredible clients.


FAQs
What is the market size of printed Thin Film Battery?
The printed thin-film battery market is projected to reach $1.5 billion by 2033, growing at a CAGR of 9.8% from its current valuation. This growth reflects increasing demand across various sectors, including consumer electronics and medical devices.
What are the key market players or companies in this printed Thin Film Battery industry?
Key players in the printed thin-film battery market include companies producing solid-state and liquid electrolyte batteries. Their innovations and advancements in technology contribute significantly to the market dynamics and competitive landscape.
What are the primary factors driving the growth in the printed Thin Film Battery industry?
Factors such as the rising adoption of portable electronic devices, the growth of renewable energy technologies, and the increasing demand for lightweight, flexible power solutions are driving growth in the printed thin-film battery market.
Which region is the fastest Growing in the printed Thin Film Battery?
The fastest-growing region for printed thin-film batteries is Europe, projected to expand from $0.40 billion in 2023 to $1.06 billion by 2033. Other regions like Asia Pacific and North America are also seeing significant growth.
Does ConsaInsights provide customized market report data for the printed Thin Film Battery industry?
Yes, ConsaInsights offers customized market reports tailored to specific client needs, including detailed insights on market size, trends, and regional analyses in the printed thin-film battery industry.
What deliverables can I expect from this printed Thin Film Battery market research project?
Expect comprehensive market research deliverables including market size analysis, growth forecasts, competitive landscape assessments, consumer insights, and tailored strategic recommendations regarding the printed thin-film battery market.
What are the market trends of printed Thin Film Battery?
Current trends in the printed thin-film battery market highlight a shift towards sustainable energy solutions, the integration of batteries in smart textiles, and innovations in manufacturing technologies such as screen printing and inkjet printing.