
Procurement Analytics Market Report
Published Date: 31 January 2026 | Report Code: procurement-analytics
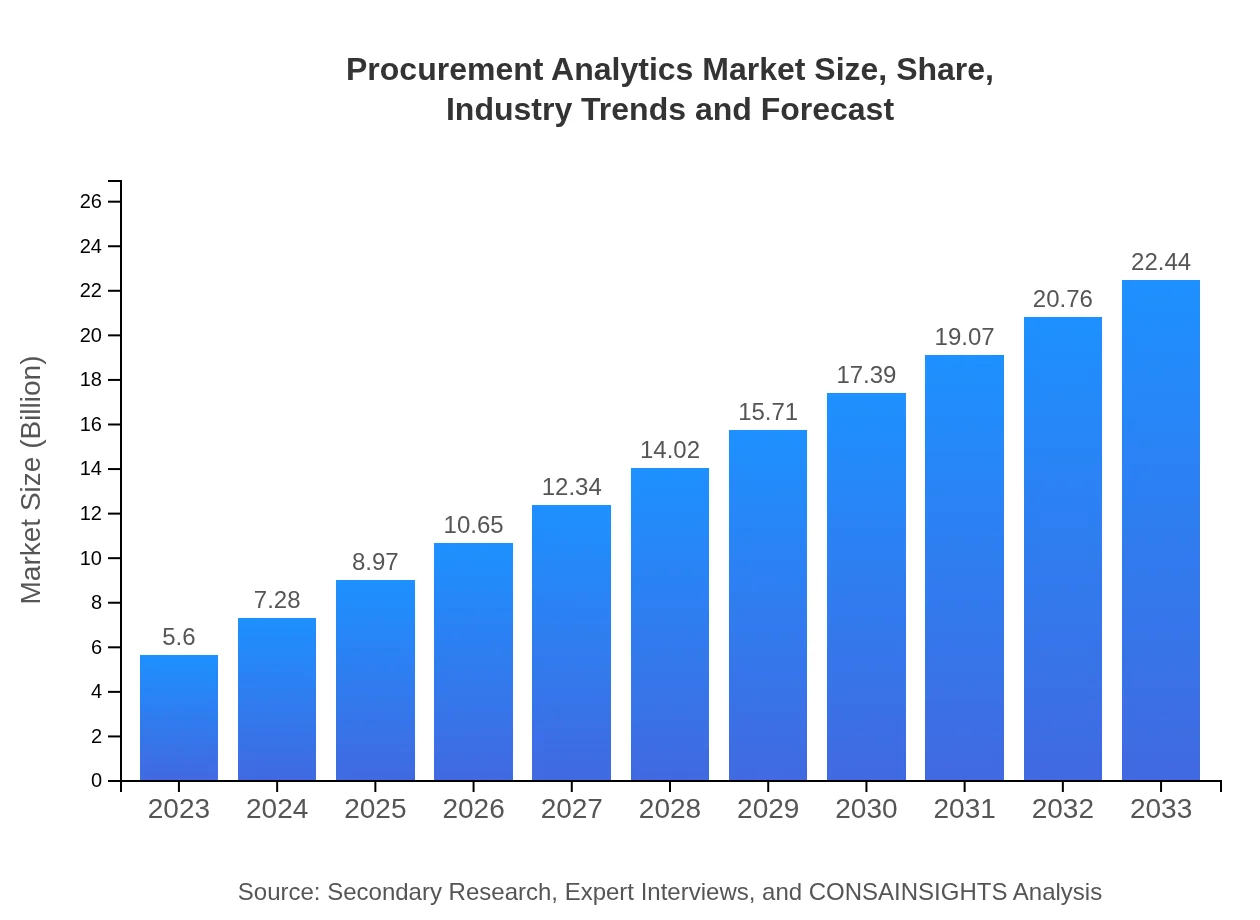
Procurement Analytics Market Size, Share, Industry Trends and Forecast to 2033
This report provides an in-depth analysis of the Procurement Analytics market from 2023 to 2033, highlighting key trends, market size, segmentation, and competitive landscape. It offers insights into the drivers, challenges, and opportunities within the sector.
| Metric | Value |
|---|---|
| Study Period | 2023 - 2033 |
| 2023 Market Size | $5.60 Billion |
| CAGR (2023-2033) | 14.2% |
| 2033 Market Size | $22.44 Billion |
| Top Companies | SAP, IBM, Oracle, Coupa, Jaggaer |
| Last Modified Date | 31 January 2026 |
Procurement Analytics Market Overview
Customize Procurement Analytics Market Report market research report
- ✔ Get in-depth analysis of Procurement Analytics market size, growth, and forecasts.
- ✔ Understand Procurement Analytics's regional dynamics and industry-specific trends.
- ✔ Identify potential applications, end-user demand, and growth segments in Procurement Analytics
What is the Market Size & CAGR of Procurement Analytics market in 2023?
Procurement Analytics Industry Analysis
Procurement Analytics Market Segmentation and Scope
Tell us your focus area and get a customized research report.
Procurement Analytics Market Analysis Report by Region
Europe Procurement Analytics Market Report:
Europe’s Procurement Analytics market is anticipated to grow from $1.54 billion in 2023 to $6.17 billion by 2033. The increasing emphasis on compliance, sustainability, and supplier collaboration is fueling this growth across various sectors.Asia Pacific Procurement Analytics Market Report:
In 2023, the Asia Pacific region's Procurement Analytics market is valued at approximately $1.07 billion and is expected to reach $4.29 billion by 2033. The growth is attributed to rapid digitalization, increasing investments in technology, and a rising focus on operational efficiency across various industries.North America Procurement Analytics Market Report:
North America represents a significant market with a size of approximately $1.85 billion in 2023, expected to reach $7.41 billion by 2033. The region's dominance is reflective of mature markets investing heavily in advanced procurement solutions to maintain competitiveness.South America Procurement Analytics Market Report:
The South American market for Procurement Analytics is valued at $0.39 billion in 2023, forecasted to grow to $1.54 billion by 2033. This growth is driven by the need for enhanced procurement effectiveness and improved supplier management in emerging economies.Middle East & Africa Procurement Analytics Market Report:
The Middle East and Africa market is estimated at $0.76 billion in 2023, with a forecasted growth to $3.03 billion by 2033. Factors such as improving economic conditions and increased focus on procurement efficiency are driving market expansion in this region.Tell us your focus area and get a customized research report.
Procurement Analytics Market Analysis By Solution Type
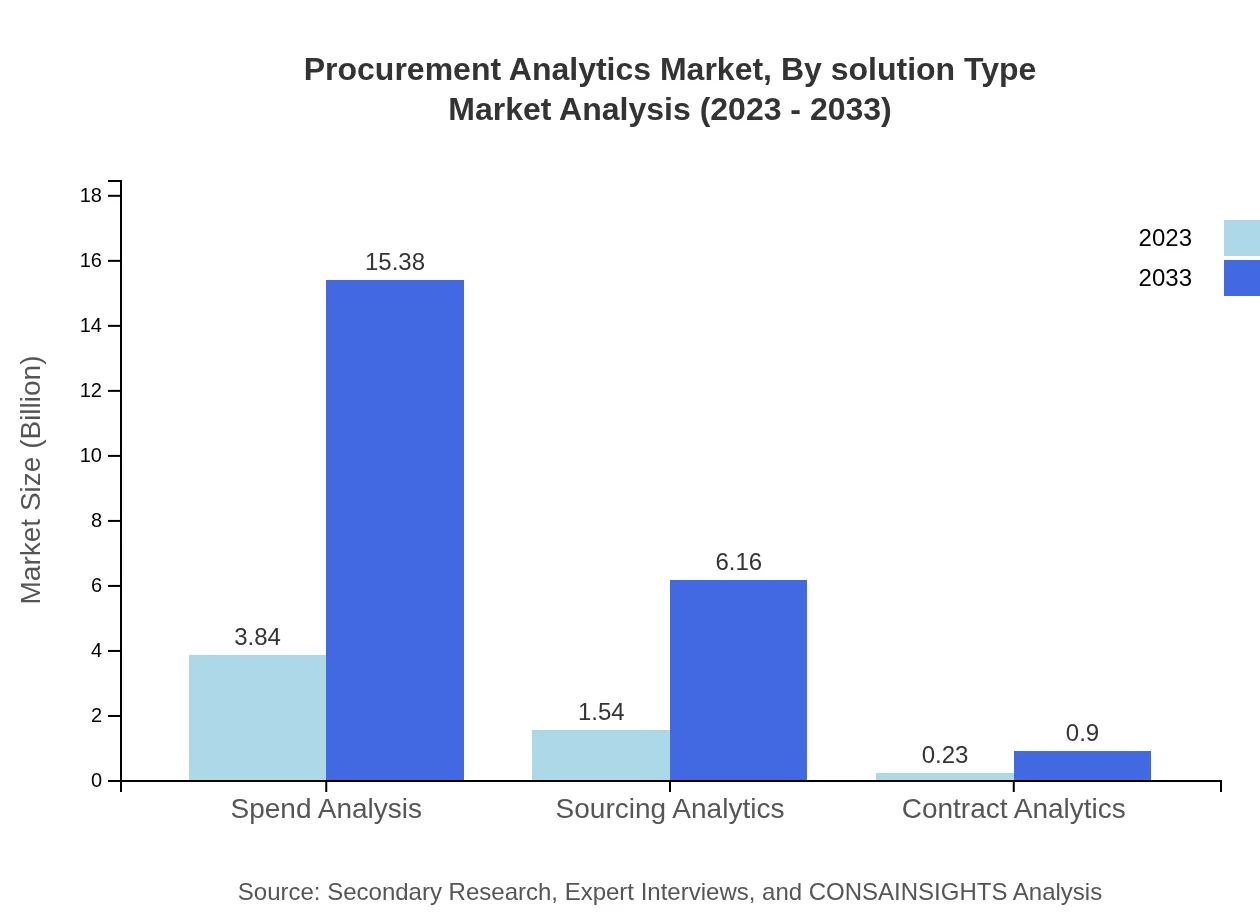
The Spend Analysis segment dominates the Procurement Analytics market, with a size of $3.84 billion in 2023, projected to grow to $15.38 billion by 2033, accounting for 68.55% market share. Sourcing Analytics follows with a 27.43% share, increasing from $1.54 billion in 2023 to $6.16 billion by 2033. Other segments include Contract Analytics, Descriptive Analytics, Predictive Analytics, and Prescriptive Analytics, indicating robust demand in specialized analytics applications.
Procurement Analytics Market Analysis By Deployment Model
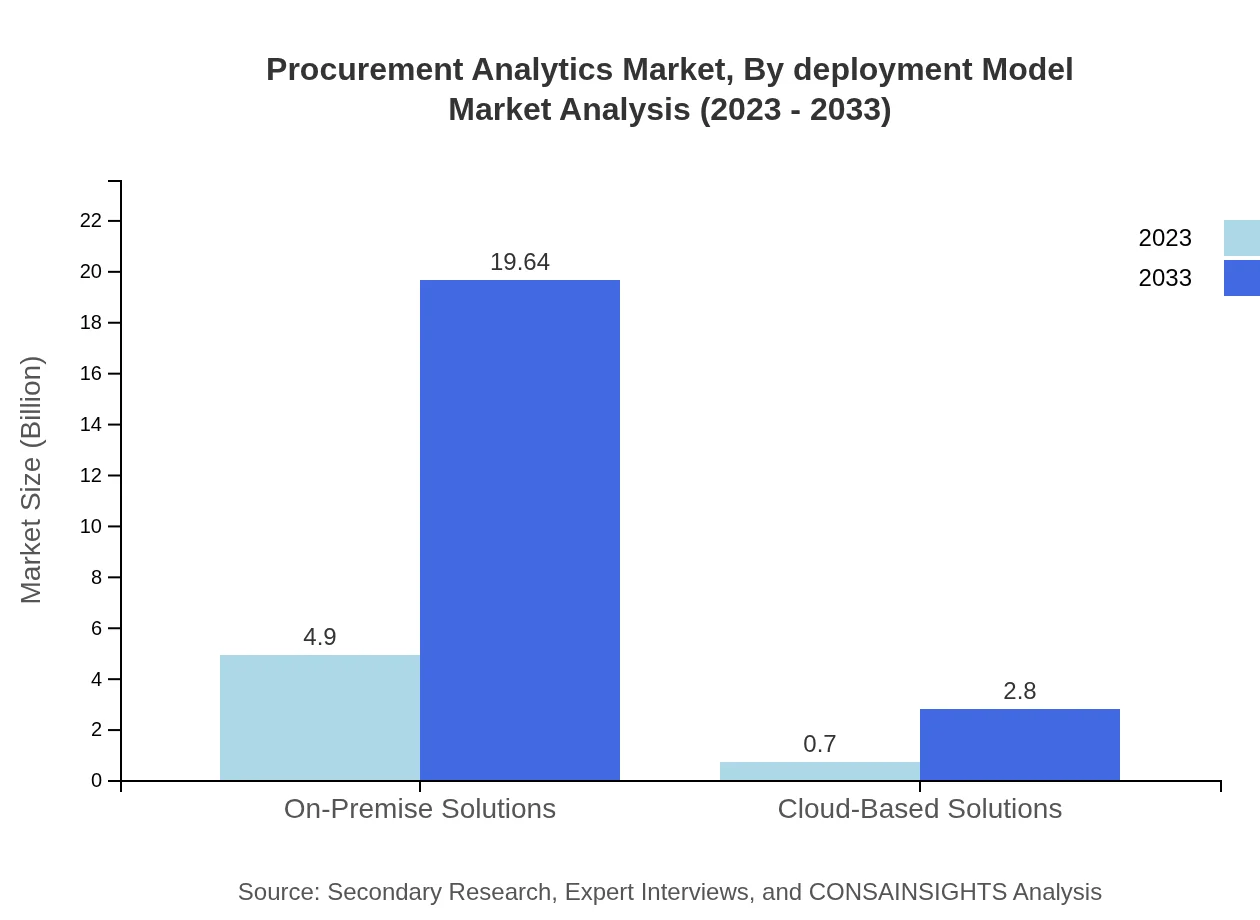
Deployment models split into On-Premise and Cloud-Based Solutions. On-Premise Solutions dominate the sector with a $4.90 billion valuation in 2023, due to the preference for data control and regulatory compliance, but forecasted to grow to $19.64 billion by 2033. Cloud-Based Solutions, gaining traction for scalability and flexibility, start at $0.70 billion in 2023, expected to reach $2.80 billion by 2033.
Procurement Analytics Market Analysis By Industry
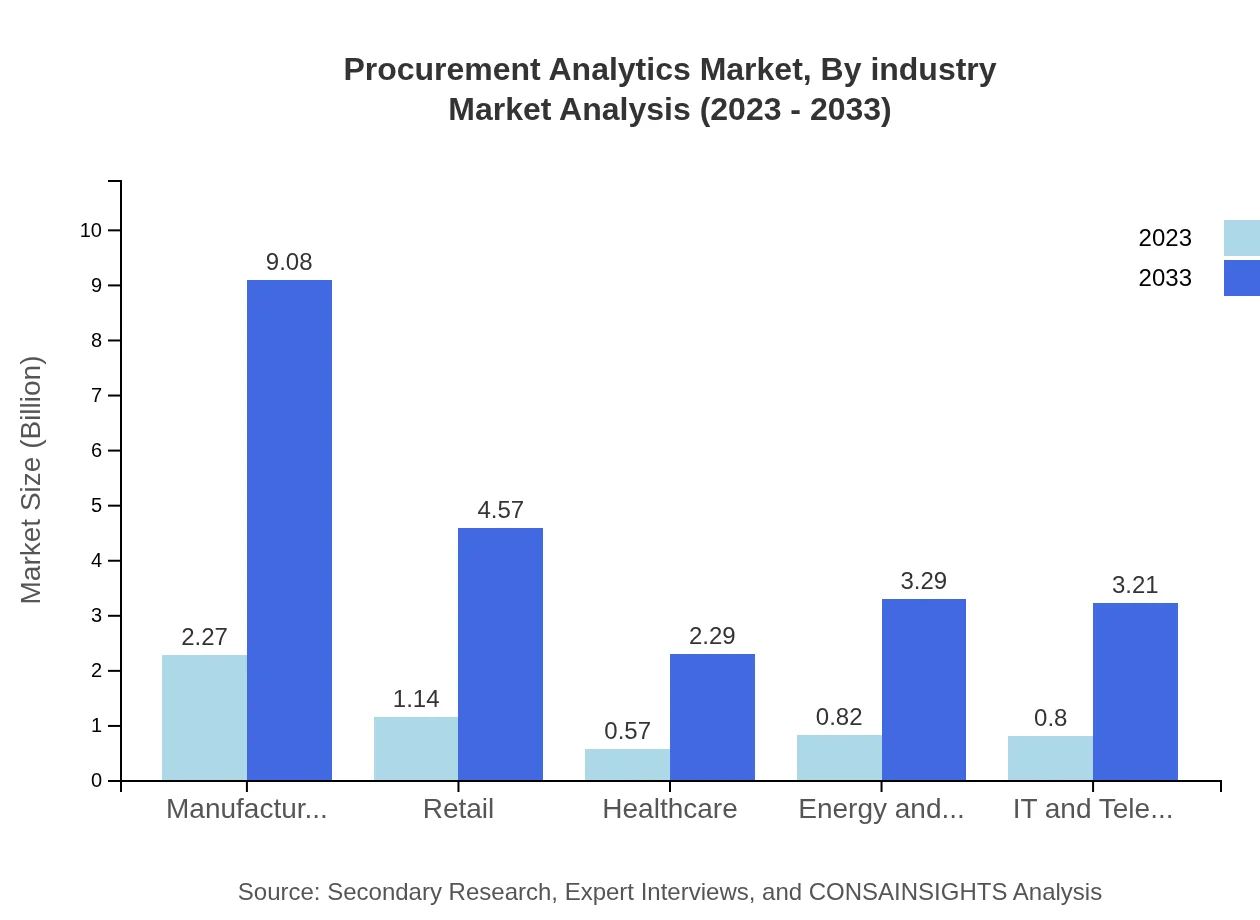
Manufacturing leads in industry application, reflecting a $2.27 billion market in 2023 and expected to grow significantly to $9.08 billion by 2033. Other sectors include Retail, Healthcare, Energy and Utilities, and IT and Telecom, all fostering necessary procurement strategies through advanced analytics solutions.
Procurement Analytics Market Analysis By Analytics Type

Descriptive Analytics holds the largest segment, valued at $3.84 billion in 2023 and anticipated to reach $15.38 billion by 2033. Predictive and Prescriptive Analytics are also vital, providing foresight into supplier performance and procurement processes, starting at $1.54 billion and expected to grow significantly over the decade.
Procurement Analytics Market Trends and Future Forecast
Tell us your focus area and get a customized research report.
Global Market Leaders and Top Companies in Procurement Analytics Industry
SAP:
SAP is a leading enterprise software provider, offering advanced procurement analytics solutions that empower organizations to optimize supply chain management and streamline procurement processes.IBM:
IBM offers powerful analytics platforms that enable businesses to gain insights from procurement data, drive efficiencies, and foster strategic supplier relationships through sophisticated data analytics.Oracle:
Oracle is known for its comprehensive suite of cloud-based procurement solutions that integrate advanced analytics, providing businesses with real-time insights to enhance decision-making.Coupa:
Coupa provides a cloud-based spend management platform that delivers robust procurement analytics tools to help organizations manage their spending and maximize supplier performance.Jaggaer:
Jaggaer focuses on digital procurement solutions, emphasizing data-driven insights and analytics to foster smarter procurement strategies and enhance operational efficiency.We're grateful to work with incredible clients.


FAQs
What is the market size of procurement Analytics?
The procurement analytics market is projected to grow from $5.6 billion in 2023 to a significantly larger market by 2033, with a CAGR of 14.2%. This growth underscores the increasing adoption of analytics solutions in procurement.
What are the key market players or companies in the procurement Analytics industry?
Key players in the procurement analytics industry include major software providers specializing in analytics and procurement solutions, which are continuously evolving their offerings to cater to the growing demand for data-driven decision-making in procurement.
What are the primary factors driving the growth in the procurement analytics industry?
Growth in the procurement analytics industry is primarily driven by increased focus on cost reduction, enhancement of supply chain efficiency, need for data-driven decision-making, and technological advancements in analytics tools and solutions.
Which region is the fastest Growing in the procurement analytics?
The fastest-growing region in procurement analytics is North America, projected to grow from $1.85 billion in 2023 to $7.41 billion by 2033, followed closely by Europe, indicating robust demand for analytics solutions.
Does ConsaInsights provide customized market report data for the procurement analytics industry?
Yes, ConsaInsights provides customized market report data tailored to specific needs and objectives within the procurement analytics industry, ensuring relevant insights for various stakeholders.
What deliverables can I expect from this procurement analytics market research project?
Deliverables from the procurement analytics market research project typically include comprehensive market reports, segmentation analysis, forecasts, and actionable insights, detailed in format tailored to client requirements.
What are the market trends of procurement analytics?
Current trends in procurement analytics include increased adoption of AI and machine learning, enhanced focus on real-time data processing, and growing demand for customizable solutions that align with specific business needs.