Set Top Box Market Report
Set-Top Box Market by Product (Cable Set-Top Boxes, Satellite Set-Top Boxes, IPTV Set-Top Boxes, Smart Set-Top Boxes), Application (Entertainment, Education, Gaming, Surveillance), End-User Industry (Residential, Commercial, Government) and Region – Analysis on Size, Share, Trends, COVID-19 Impact, Competitive Analysis, Growth Opportunities and Key Insights from 2023 to 2030.
01 Executive Summary
Set Top Box Market Size & CAGR
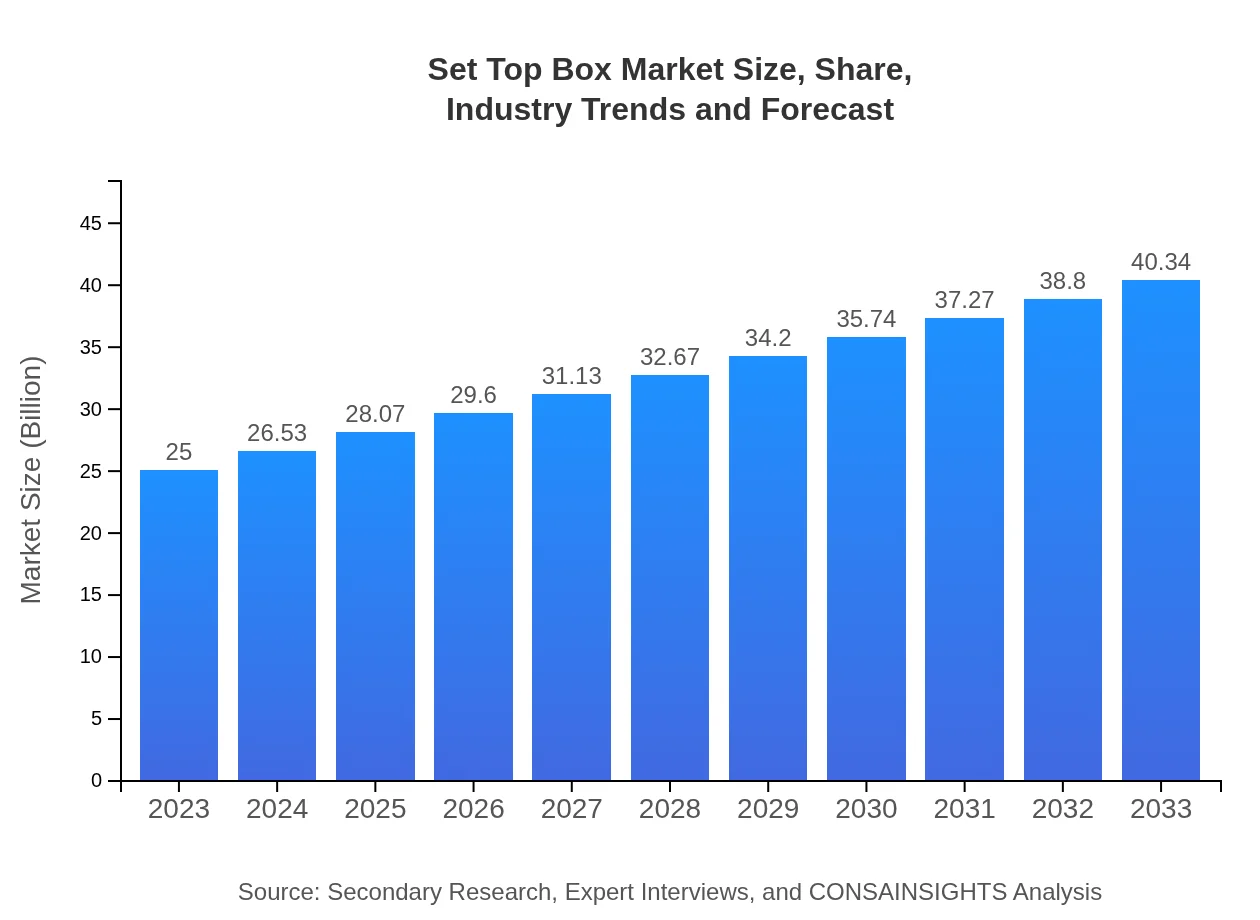
** The Set Top Box market size is projected to reach USD 15.6 billion by the year 2023, growing at a CAGR of 5.8% from 2023 to 2030. The forecast growth rate from 2023 to 2030 is expected to be steady, driven by technological advancements and increased demand for advanced entertainment solutions. **COVID-19 Impact on the Set Top Box Market
** The COVID-19 pandemic has significantly impacted the Set Top Box market, with disruptions in the supply chain and manufacturing processes leading to delays in product launches and distribution. The lockdown measures implemented in various regions have also affected consumer spending patterns, resulting in a shift towards online streaming services. **Set Top Box Market Dynamics
** The dynamics of the Set Top Box market are influenced by factors such as technological advancements, changing consumer preferences, and competitive landscape. Key drivers include the growing demand for high-quality content, increasing internet penetration, and the rise of smart TVs. However, challenges such as piracy, regulatory issues, and high competition pose threats to market growth. **Segments and Related Analysis of the Set Top Box market
** The Set Top Box market can be segmented based on technology, product, application, and end-user. Technologies include cable, satellite, IPTV, and OTT. Products range from basic STBs to advanced hybrid devices. Applications cover residential and commercial sectors, while end-users include individual consumers and businesses. **Set Top Box Market Analysis Report by Region
** The Set Top Box market analysis report by region shows significant growth potential in various regions including Asia Pacific, South America, North America, Europe, and the Middle East and Africa. Each region has its unique market challenges and opportunities that influence the demand for Set Top Box solutions. **Asia Pacific Set Top Box Market Report
** The Asia Pacific region is a key market for Set Top Box solutions, with countries like China, Japan, and India driving growth in the region. The increasing adoption of digital entertainment platforms and rising disposable incomes are key factors contributing to market expansion in this region. **South America Set Top Box Market Report
** In South America, the Set Top Box market is witnessing steady growth, fueled by the growing demand for digital TV services and increasing investment in infrastructure development. Countries like Brazil and Mexico are key players in the South American market. **North America Set Top Box Market Report
** North America is a mature market for Set Top Box solutions, with the United States and Canada leading in terms of market penetration and technological advancements. The region is characterized by a high demand for high-definition content and a strong presence of key market players. **Europe Set Top Box Market Report
** Europe is a diverse market for Set Top Box solutions, with countries like the United Kingdom, Germany, and France driving market growth. The region is characterized by a mix of traditional cable services and emerging IPTV and OTT platforms, offering a wide range of choices to consumers. **Middle East and Africa Set Top Box Market Report
** The Middle East and Africa region are experiencing rapid growth in the Set Top Box market, driven by increasing urbanization, rising disposable incomes, and growing demand for digital entertainment services. Countries like the UAE, Saudi Arabia, and South Africa are key players in this market. **Set Top Box Market Analysis Report by Technology
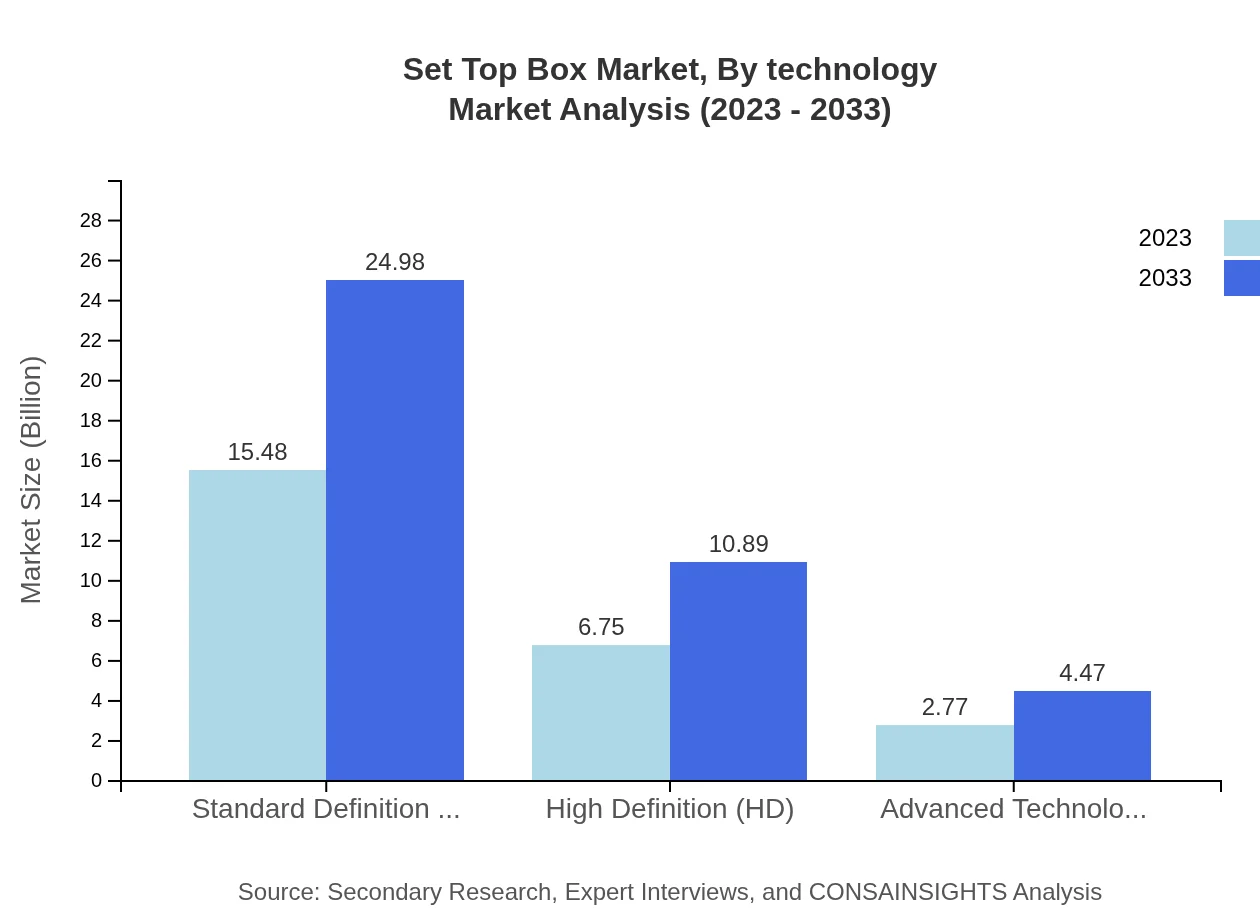
** The Set Top Box market analysis report by technology covers different types of STBs such as cable, satellite, IPTV, and OTT. Each technology has its unique features and advantages, catering to diverse consumer preferences and requirements. **Set Top Box Market Analysis Report by Product
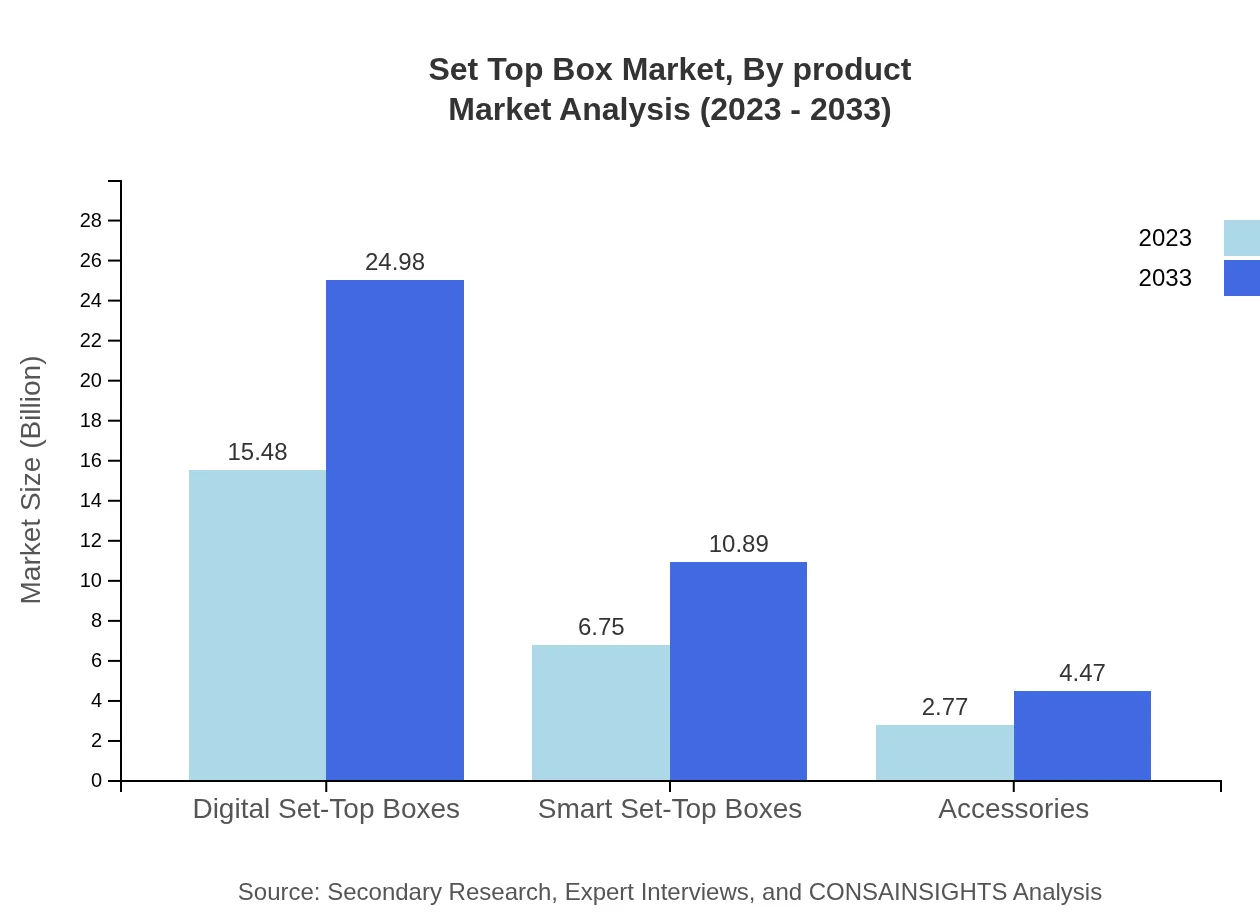
** The Set Top Box market analysis report by product includes basic STBs, hybrid devices, and advanced smart TV solutions. Manufacturers are focusing on innovation and product differentiation to stay competitive in the market and meet evolving consumer needs. **Set Top Box Market Analysis Report by Application
** The Set Top Box market analysis report by application assesses the demand for STB solutions in residential and commercial sectors. Residential applications include entertainment, gaming, and personalization, while commercial applications encompass hospitality, healthcare, and education. **Set Top Box Market Analysis Report by End-User
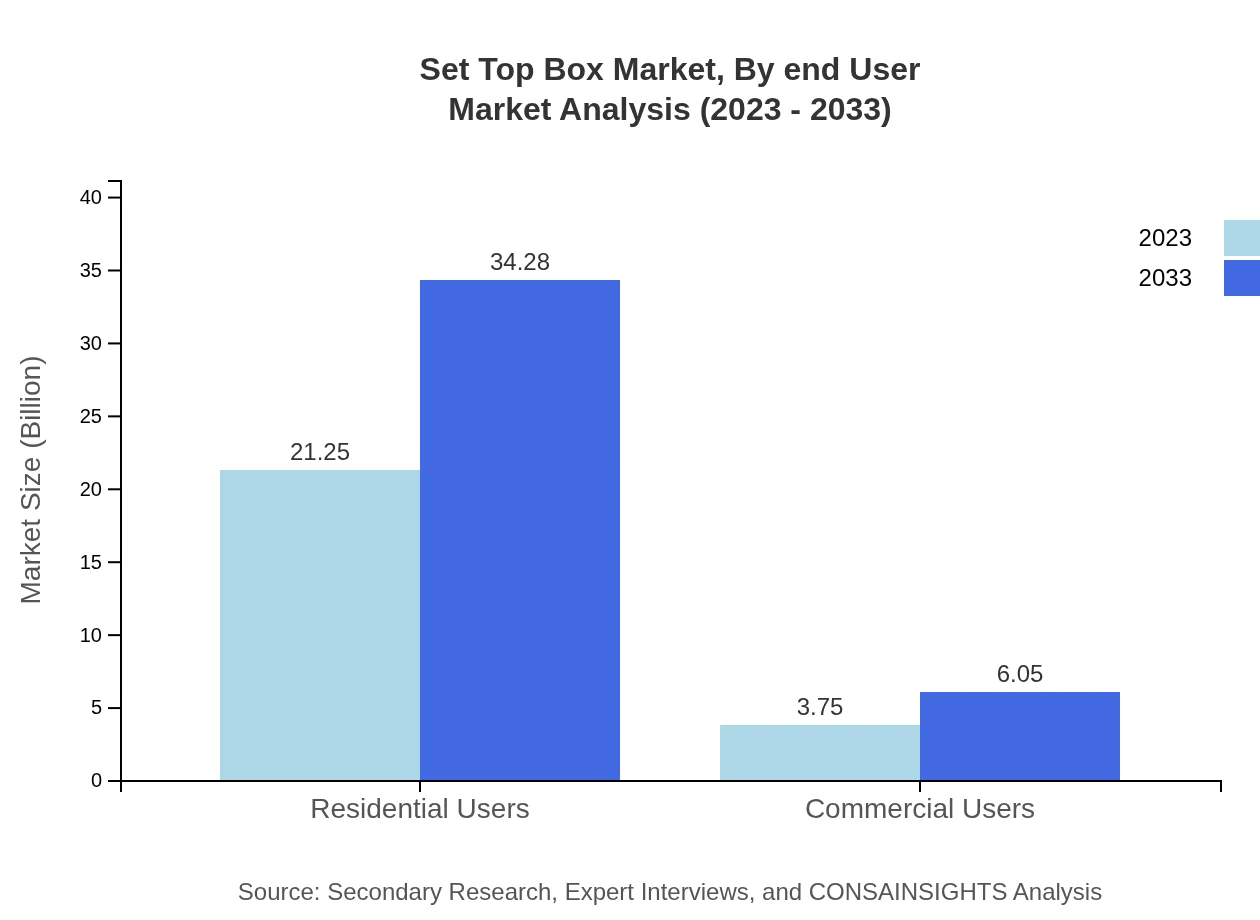
** The Set Top Box market analysis report by end-user covers individual consumers and businesses. Individual consumers seek entertainment and convenience, while businesses utilize STB solutions for advertising, training, and communication purposes. **Key Growth Drivers and Key Market Players of Set Top Box Market and Competitive Landscape
** Key growth drivers for the Set Top Box market include the increasing demand for digital entertainment, technological advancements, and the rise of smart TV platforms. Key market players include Samsung, LG, Sony, Huawei, and Apple, among others, who dominate the market with innovative products and strong brand presence. **Set Top Box Market Trends and Future Forecast
** The Set Top Box market is witnessing trends such as the shift towards smart TV solutions, the integration of AI and IoT technologies, and the rise of personalized content delivery. The future forecast for the market indicates continued growth and evolution in line with consumer preferences and technological advancements. **Recent Happenings in the Set Top Box Market
** Recent developments in the Set Top Box market include new product launches, partnerships, and strategic acquisitions by key market players. For example, Samsung introduced a new range of smart STB solutions, while LG collaborated with Netflix to enhance the streaming experience for consumers.Set Top Box Market Size & CAGR
** The Set Top Box market size is projected to reach USD 15.6 billion by the year 2023, growing at a CAGR of 5.8% from 2023 to 2030. The forecast growth rate from 2023 to 2030 is expected to be steady, driven by technological advancements and increased demand for advanced entertainment solutions. **COVID-19 Impact on the Set Top Box Market
** The COVID-19 pandemic has significantly impacted the Set Top Box market, with disruptions in the supply chain and manufacturing processes leading to delays in product launches and distribution. The lockdown measures implemented in various regions have also affected consumer spending patterns, resulting in a shift towards online streaming services. **Set Top Box Market Dynamics
** The dynamics of the Set Top Box market are influenced by factors such as technological advancements, changing consumer preferences, and competitive landscape. Key drivers include the growing demand for high-quality content, increasing internet penetration, and the rise of smart TVs. However, challenges such as piracy, regulatory issues, and high competition pose threats to market growth. **Segments and Related Analysis of the Set Top Box market
** The Set Top Box market can be segmented based on technology, product, application, and end-user. Technologies include cable, satellite, IPTV, and OTT. Products range from basic STBs to advanced hybrid devices. Applications cover residential and commercial sectors, while end-users include individual consumers and businesses. **Set Top Box Market Analysis Report by Region
** The Set Top Box market analysis report by region shows significant growth potential in various regions including Asia Pacific, South America, North America, Europe, and the Middle East and Africa. Each region has its unique market challenges and opportunities that influence the demand for Set Top Box solutions. **Asia Pacific Set Top Box Market Report
** The Asia Pacific region is a key market for Set Top Box solutions, with countries like China, Japan, and India driving growth in the region. The increasing adoption of digital entertainment platforms and rising disposable incomes are key factors contributing to market expansion in this region. **South America Set Top Box Market Report
** In South America, the Set Top Box market is witnessing steady growth, fueled by the growing demand for digital TV services and increasing investment in infrastructure development. Countries like Brazil and Mexico are key players in the South American market. **North America Set Top Box Market Report
** North America is a mature market for Set Top Box solutions, with the United States and Canada leading in terms of market penetration and technological advancements. The region is characterized by a high demand for high-definition content and a strong presence of key market players. **Europe Set Top Box Market Report
** Europe is a diverse market for Set Top Box solutions, with countries like the United Kingdom, Germany, and France driving market growth. The region is characterized by a mix of traditional cable services and emerging IPTV and OTT platforms, offering a wide range of choices to consumers. **Middle East and Africa Set Top Box Market Report
** The Middle East and Africa region are experiencing rapid growth in the Set Top Box market, driven by increasing urbanization, rising disposable incomes, and growing demand for digital entertainment services. Countries like the UAE, Saudi Arabia, and South Africa are key players in this market. **Set Top Box Market Analysis Report by Technology
** The Set Top Box market analysis report by technology covers different types of STBs such as cable, satellite, IPTV, and OTT. Each technology has its unique features and advantages, catering to diverse consumer preferences and requirements. **Set Top Box Market Analysis Report by Product
** The Set Top Box market analysis report by product includes basic STBs, hybrid devices, and advanced smart TV solutions. Manufacturers are focusing on innovation and product differentiation to stay competitive in the market and meet evolving consumer needs. **Set Top Box Market Analysis Report by Application
** The Set Top Box market analysis report by application assesses the demand for STB solutions in residential and commercial sectors. Residential applications include entertainment, gaming, and personalization, while commercial applications encompass hospitality, healthcare, and education. **Set Top Box Market Analysis Report by End-User
** The Set Top Box market analysis report by end-user covers individual consumers and businesses. Individual consumers seek entertainment and convenience, while businesses utilize STB solutions for advertising, training, and communication purposes. **Key Growth Drivers and Key Market Players of Set Top Box Market and Competitive Landscape
** Key growth drivers for the Set Top Box market include the increasing demand for digital entertainment, technological advancements, and the rise of smart TV platforms. Key market players include Samsung, LG, Sony, Huawei, and Apple, among others, who dominate the market with innovative products and strong brand presence. **Set Top Box Market Trends and Future Forecast
** The Set Top Box market is witnessing trends such as the shift towards smart TV solutions, the integration of AI and IoT technologies, and the rise of personalized content delivery. The future forecast for the market indicates continued growth and evolution in line with consumer preferences and technological advancements. **Recent Happenings in the Set Top Box Market
** Recent developments in the Set Top Box market include new product launches, partnerships, and strategic acquisitions by key market players. For example, Samsung introduced a new range of smart STB solutions, while LG collaborated with Netflix to enhance the streaming experience for consumers.GLOBAL ARTIFICIAL INTELLIGENCE MARKET SIZE, BY PRODUCT, 2023-2030 (USD BILLION)
By Product | 2023 | 2024 | 2025 | 2026 | 2027 | 2028 | 2029 | 2030 | CAGR (2023-2030) |
---|---|---|---|---|---|---|---|---|---|
Forecast | |||||||||
Cable Set-Top Boxes | xx | xx | xx | xx | xx | xx | xx | xx | xx |
Satellite Set-Top Boxes | xx | xx | xx | xx | xx | xx | xx | xx | xx |
IPTV Set-Top Boxes | xx | xx | xx | xx | xx | xx | xx | xx | xx |
Smart Set-Top Boxes | xx | xx | xx | xx | xx | xx | xx | xx | xx |
GLOBAL ARTIFICIAL INTELLIGENCE MARKET SIZE, BY APPLICATION, 2023-2030 (USD BILLION)
By Application | 2023 | 2024 | 2025 | 2026 | 2027 | 2028 | 2029 | 2030 | CAGR (2023-2030) |
---|---|---|---|---|---|---|---|---|---|
Forecast | |||||||||
Entertainment | xx | xx | xx | xx | xx | xx | xx | xx | xx |
Education | xx | xx | xx | xx | xx | xx | xx | xx | xx |
Gaming | xx | xx | xx | xx | xx | xx | xx | xx | xx |
Surveillance | xx | xx | xx | xx | xx | xx | xx | xx | xx |
GLOBAL ARTIFICIAL INTELLIGENCE MARKET SIZE, BY END-USER INDUSTRY, 2023-2030 (USD BILLION)
By End-User Industry | 2023 | 2024 | 2025 | 2026 | 2027 | 2028 | 2029 | 2030 | CAGR (2023-2030) |
---|---|---|---|---|---|---|---|---|---|
Forecast | |||||||||
Residential | xx | xx | xx | xx | xx | xx | xx | xx | xx |
Commercial | xx | xx | xx | xx | xx | xx | xx | xx | xx |
Government | xx | xx | xx | xx | xx | xx | xx | xx | xx |
02 Research Methodology
Our research methodology entails an ideal mixture of primary and secondary initiatives. Key steps involved in the process are listed below:
-
Step 1. Data collection and Triangulation
This stage involves gathering market data from various sources to ensure accuracy and comprehensiveness.
-
Step 2. Primary and Secondary Data Research
Conducting in-depth research using both primary data (interviews, surveys) and secondary data (reports, articles) to gather relevant information.
-
Step 3. Data analysis
Analyzing and interpreting the collected data to identify patterns, trends, and insights that can inform decision-making.
-
Step 4. Data sizing and forecasting
Estimating the size of the market and forecasting future trends based on the analyzed data to guide strategic planning.
-
Step 5. Expert analysis and data verification
Engaging subject matter experts to review and verify the accuracy and reliability of the data and findings.
-
Step 6. Data visualization
Creating visual representations such as charts and graphs to effectively communicate the data findings to stakeholders.
-
Step 7. Reporting
Compiling a comprehensive report that presents the research findings, insights, and recommendations in a clear and concise manner.
Data collection and Triangulation
The foundation is meticulous data gathering from multiple primary and secondary sources through interviews, surveys, industry databases, and publications. We critically triangulate these data points, cross-verifying and correlating findings to ensure comprehensiveness and accuracy.
Primary and Secondary Data Research
Our approach combines robust primary research discussion with industry experts and an exhaustive study of secondary data sources. A comprehensive analysis of published information from credible databases, journals, and market research reports complements direct interactions with industry stakeholders and key opinion leaders.
Data analysis
With a wealth of data at our disposal, our seasoned analysts meticulously examine and interpret the findings. Leveraging advanced analytical tools and techniques, we identify trends, patterns, and correlations, separating signal from noise to uncover profound insights that shed light on market realities.
Data sizing and forecasting
Armed with a profound understanding of market dynamics, our specialists employ robust statistical models and proprietary algorithms to size markets accurately. We go a step further, harnessing our predictive capabilities to forecast future trajectories, empowering clients with foresight for informed decision-making.
Expert analysis and data verification
Our research findings undergo a rigorous review by a panel of subject matter experts who lend their deep industry knowledge. This critical analysis ensures our insights are comprehensive and aligned with real-world dynamics. We also meticulously verify each data point, leaving no stone unturned in our pursuit of accuracy.
Data visualization
To unlock the true potential of our research, we employ powerful data visualization techniques. Our analysts transform complex datasets into intuitive visuals, including charts, graphs, and interactive dashboards. This approach facilitates seamless communication of key insights, enabling stakeholders to comprehend market intricacies at a glance.
Reporting
The final step is providing detailed reports that combine our in-depth analysis with practical advice. Our reports are designed to give clients a competitive edge by clearly explaining market complexities and highlighting emerging opportunities they can take advantage of.
03 Market Overview
Market Definition and Scope
The set-top box (STB) market pertains to devices that receive and decode signals from various broadcast media, allowing viewers to access television content. These devices encompass a variety of applications, including traditional cable, satellite, and even streaming platforms that link to conventional televisions. As a result, the market's scope extends to both hardware manufacturers and service providers that deliver content through these devices.
This market is influenced heavily by advancements in technology and consumer demand for diverse content. The scope expands to include digital video recording capabilities, user interfaces, and the integration of smart capabilities within STBs. Additionally, the emergence of OTT (over-the-top) services transforms how content is delivered, compelling traditional providers to innovate and adapt their offerings.
Moreover, the set-top box market is intertwined with broader shifts in consumer behavior towards viewing preferences. Today's consumers are increasingly prioritizing flexibility and personalized content, thus, influencing suppliers to enhance STB functionalities. The interaction between STBs and smart home devices further expands their scope, integrating entertainment with automation and connectivity, thus highlighting the demand for multifunctional devices.
The geographical fragmentation of the market is another critical aspect, with various regions exhibiting different growth patterns based on technology adoption, urbanization, and income levels. Emerging economies are witnessing rapid growth in STB penetration, driven by improving telecommunications infrastructure and an increase in disposable income among consumers. Consequently, market players must consider regional nuances when strategizing their business approaches.
In summary, the set-top box market is a dynamic sector influenced by multiple factors, including technological advancements, consumer preferences, geographical variances, and the integration of cross-platform services. Understanding these facets is essential for stakeholders aiming to capitalize on growth opportunities in this continually evolving market.
Market Segmentation
The set-top box market can be segmented based on several criteria, each providing valuable insights into consumer behavior and market trends. The primary categories include type, application, distribution channel, and region. Each of these segments allows stakeholders to tailor their strategies according to specific consumer needs and market demands.
When segmenting by type, the market is primarily divided into satellite, cable, and internet protocol (IP) set-top boxes. Each segment reflects distinct consumer preferences and technological influences. For instance, the growth in internet protocol television (IPTV) usage is rapidly increasing the demand for IP STBs as consumers shift towards on-demand content consumption.
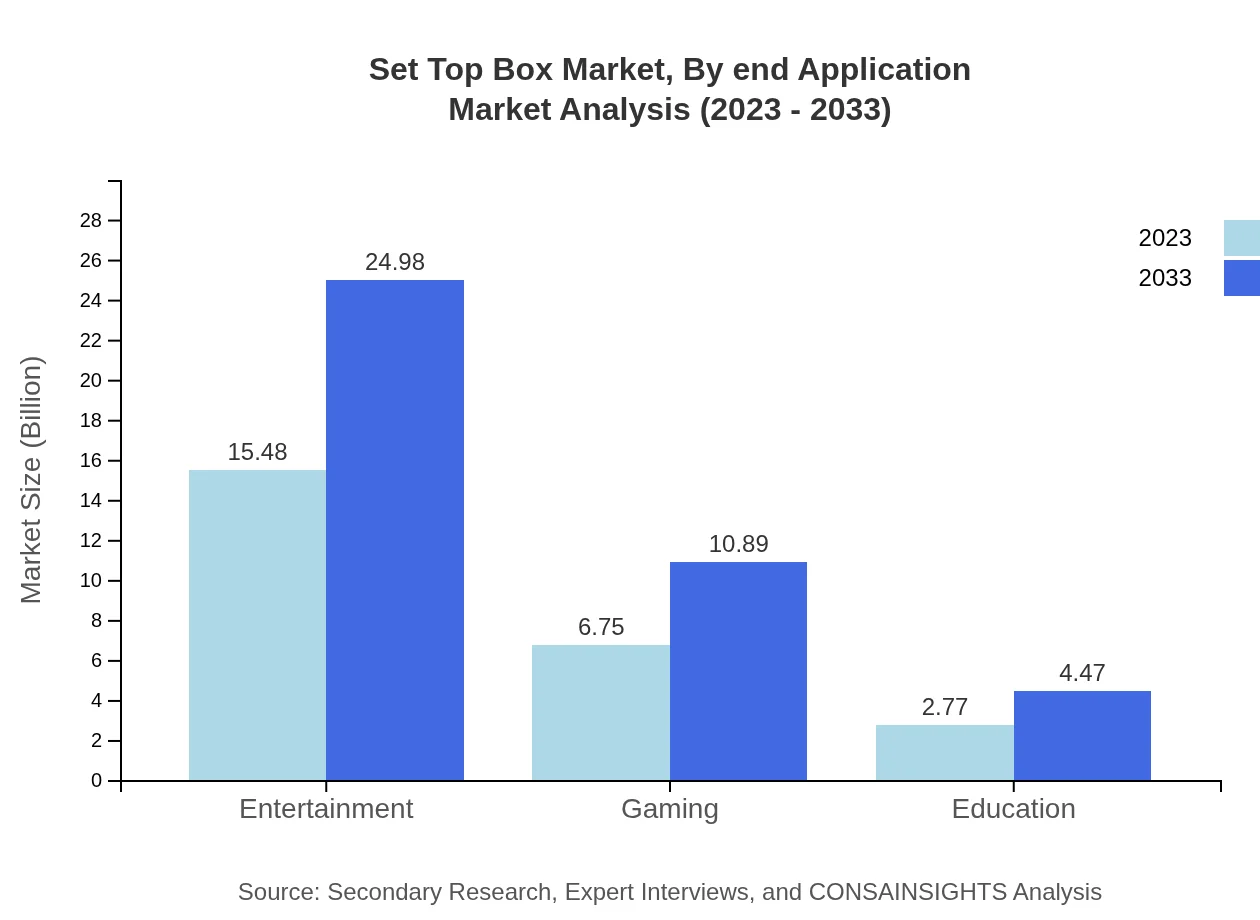
Application-based segmentation further distinguishes the market. It includes segments such as residential, commercial, and institutional applications. The residential segment dominates the market due to the increasing number of households seeking flexible viewing options and enhanced digital functionalities. The commercial segment is also significant, as hotels and restaurants seek to offer more entertainment options to attract and retain customers.
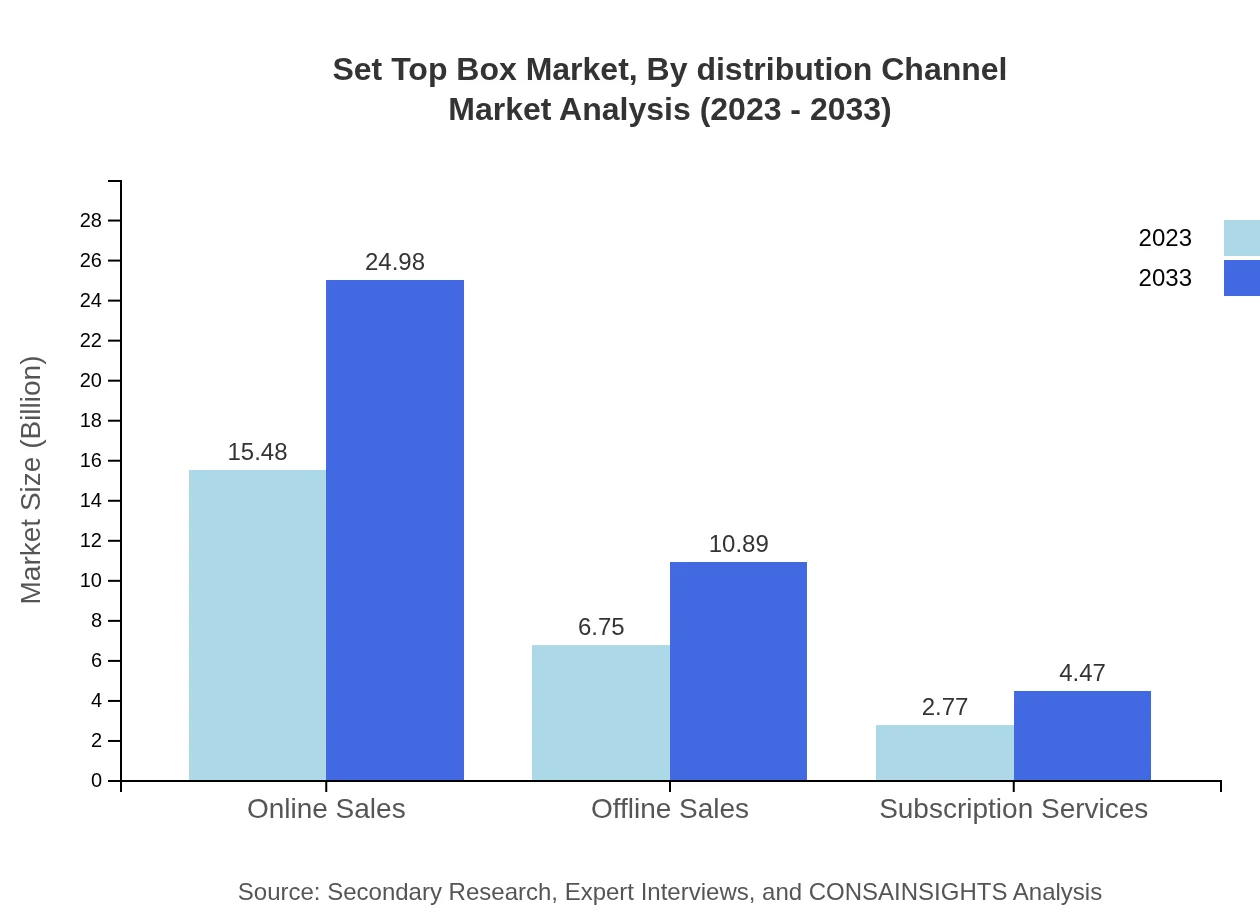
Another important aspect of segmentation is the distribution channel, which can be analyzed through direct sales, online purchases, and third-party retailers. The rise of e-commerce has led to an impressive growth in online sales of set-top boxes, offering consumers the convenience of shopping from home while finding competitive pricing and product reviews.
Regionally, the set-top box market can be divided into North America, Europe, Asia-Pacific, Latin America, and the Middle East & Africa. Each region has unique drivers influencing growth, with Asia-Pacific expected to witness significant expansion due to rising disposable incomes and urbanization. Understanding the segmentation helps industry players target specific market segments effectively and enhances their competitive advantage.
Currency
The currency utilized in analyzing the set-top box market is vital for accurately interpreting market data and forecasts. The predominant currency within this analysis is the US Dollar (USD), as it offers a standard benchmark that stakeholders can use for comparison across different regions and segments.
For market assessments, the revenue generated from sales of STBs, along with the projected growth rates, is represented in USD. This allows investors, manufacturers, and market analysts to streamline their financial evaluations. Furthermore, converting data into a single currency such as USD mitigates discrepancies that may arise from fluctuations in local currencies and varying economic conditions across countries.
Adopting USD as the principal currency simplifies the analysis, particularly when discussing international markets, as it facilitates clear communication of findings regardless of the geographical context. Stakeholders can readily assess performance metrics and growth trajectories when all figures are standardized to a common currency.
Additionally, local currencies may still be analyzed in market reports to provide a more comprehensive overview of specific regions, but the conversion to USD serves as the main reference point for global analysis. By using a uniform currency, market forecasts and growth potentials can seamlessly integrate, accommodating various economic scenarios.
In conclusion, establishing a clear and consistent currency representation, predominantly USD, is crucial in the set-top box market analysis. It aids market participants in making informed strategic decisions backed by comprehensive, standardized data across diverse markets.
Forecast
The forecast for the set-top box market is grounded in thorough analyses of historical data, industry trends, technological advancements, and changing consumer behaviors. These elements paint a vivid picture of what to expect in the coming years, showcasing both challenges and growth opportunities for market players.
Based on current trends, the STB market is anticipated to witness substantial growth, projected at a compound annual growth rate (CAGR) of around 5-8% over the next five years. Key drivers of this growth include increasing internet penetration, the proliferation of smart devices, and the demand for high-definition content, which collectively create an environment ripe for STB adoption.
Moreover, the integration of advanced technologies such as artificial intelligence (AI) and machine learning into STBs is set to enhance the user experience significantly. These technologies enable personalized viewing recommendations and smart functionalities that cater to individual viewer preferences. As a result, consumers are expected to favor STBs that offer superior features, further propelling market growth.
Geographical variations are salient in the forecast, with emerging markets like Asia-Pacific showing the most promising potential. Factors such as rapid urbanization, a growing number of internet users, and increased investments in telecommunications infrastructure contribute to a burgeoning market for STBs in these regions. Market participants must prioritize their product strategies accordingly to capture these growth opportunities effectively.
In summary, the forecast for the set-top box market is optimistic, supported by multiple growth drivers and a continuous evolution in consumer content consumption. Future prospects indicate the need for manufacturers to innovate and adapt to stay competitive, catering to a tech-savvy consumer base with heightened expectations for their viewing experiences.
Assumptions
In conducting a comprehensive analysis of the set-top box market, several key assumptions underpin the findings and forecasts. These assumptions are critical for ensuring that the projections remain relevant and reflective of market dynamics, particularly as the industry undergoes rapid transformation.
One of the primary assumptions is the continued growth of internet connectivity and access to broadband services globally. As high-speed internet becomes more ubiquitous, it is assumed that consumers will increasingly shift towards streaming content, thereby bolstering the demand for smart set-top boxes capable of handling such services efficiently.
Additionally, it is assumed that technological advancements will persist at a rapid pace, leading to the development of more sophisticated STB devices. Innovations in hardware and software are expected to enhance functionalities, including integration with other devices and smart ecosystems, thereby creating a seamless viewing experience for users.
Furthermore, consumer preferences are assumed to shift towards more personalized, on-demand content. As consumers seek flexibility in their viewing habits, it is anticipated that STBs that offer robust support for various streaming applications and services will gain traction in the market.
Finally, regulatory environments and market competition are important assumptions that must be considered. Regulatory changes in different regions can impact the availability of services, alter market dynamics, and change consumer spending behaviors. Understanding these regulations is crucial for stakeholders strategizing their market approaches effectively.
04 Market Dynamics
Market Drivers
The set-top box market is experiencing robust growth driven by several key factors that are reshaping the consumer electronics landscape. As households increasingly seek enhanced entertainment experiences, the demand for advanced set-top boxes that can deliver high-quality content such as 4K and HDR becomes paramount. These enhancements not only provide superior viewing experiences but also facilitate seamless integration with smart home technologies, which is appealing to tech-savvy consumers. Additionally, the proliferation of over-the-top (OTT) services has catalyzed the demand for set-top boxes that can provide access to a wider array of content, thus pushing traditional cable service providers to innovate and adapt their offerings.
Furthermore, the shift from traditional linear TV to on-demand viewing is encouraging consumers to invest in more sophisticated set-top box solutions. Consumers are increasingly looking for devices that allow them to curate their content, pause, rewind, and record live television, transforming how they interact with media. This transition is further propelled by the rising popularity of subscription-based services, which often require compatible set-top boxes. As streaming continues to dominate viewership patterns, manufacturers are compelled to develop set-top boxes that can cater to these changing consumption habits.
The evolution of consumer preferences towards mobile and smart devices represents another substantial driver for the market. Set-top box manufacturers are now focusing on creating products that not only serve as traditional TV decoders but also allow for cross-platform content sharing. For instance, features that enable users to watch shows on their mobile devices while simultaneously streaming content on their televisions are becoming a mainstay in product offerings. This level of convenience and flexibility in content accessibility deeply resonates with modern consumers.
Moreover, significant advancements in technology and connectivity have also played a pivotal role in bolstering the set-top box market. The rollout of high-speed broadband networks, including 5G technology, enables faster streaming, which, in turn, enhances the user experience. This seamless connectivity ensures that consumers can access their favorite content promptly without interruptions, thus increasing their dependency on set-top boxes as primary content delivery systems. Such developments are likely to create further opportunities for manufacturers to innovate and diversify their product offerings.
Lastly, government regulations and incentive programs promoting digital transitions encourage the adoption of set-top boxes. In various regions, initiatives aimed at improving access to digital content and promoting technology adoption contribute to a favorable regulatory environment that spurs consumer spending. As governments strive to bridge the digital divide, they often support the dissemination of affordable set-top boxes to enhance media access, especially in underserved areas.
Market Restraints
Despite its promising outlook, the set-top box market faces several restraints that could potentially hinder its growth trajectory. One of the primary challenges stems from the increasing competition from alternative media consumption platforms. With the rise of smart TVs, mobile streaming devices, and gaming consoles capable of delivering similar content experiences, traditional set-top boxes are losing their appeal. Consumers often prefer integrated solutions that do not require multiple gadgets, leading to a decline in set-top box sales.
Another significant restraint is the rapidly changing technological landscape, which poses a threat to manufacturers trying to keep pace with advancements. The integrated nature of digital media consumption means that set-top box features become obsolete quickly as new technologies and user preferences evolve. Consequently, companies are compelled to continuously innovate, which can result in increased costs and heavy investment pressures that may not translate into proportional revenue growth.
Moreover, affordability remains a considerable barrier for many consumers. While premium set-top boxes often provide enhanced features and superior user experiences, their price points can be a deterrent to budget-conscious consumers. This price sensitivity can lead to a wider market disparity where only affluent households invest in high-end models, leaving a significant market segment unaddressed. Manufacturers must continue to refine their pricing strategies to appeal to a broader consumer base.
In addition, the complex ecosystem of licensing, content rights, and partnerships often complicates the operational landscape for set-top box providers. The need to navigate various agreements and collaborations to ensure content availability can be both time-consuming and costly. Such complexities may discourage new entrants from participating in the market, thus reducing competition and innovation.
Market Opportunities
The set-top box market is infused with a plethora of opportunities that manufacturers and service providers can capitalize on to drive future growth. One of the most promising avenues is the increasing demand for smart home integration and IoT solutions. As consumers increasingly adopt smart home technologies, there is a growing need for set-top boxes that seamlessly connect and control multiple devices within the home ecosystem. By developing products that serve as central hubs for various smart devices, manufacturers can cater to the evolving needs of consumers looking for convenience and functionality in their entertainment systems.
Furthermore, the global expansion of OTT streaming services presents a lucrative opportunity for set-top box providers. The consistent surge in subscriptions to platforms such as Netflix, Hulu, and Amazon Prime offers a prime avenue for growth. Consequently, creating versatile set-top boxes that support multiple streaming services and feature user-friendly interfaces can attract consumer attention and bolster market penetration. By positioning products that enhance the consumer viewing experience across various OTT platforms, manufacturers can strengthen their market positioning.
The advancement of artificial intelligence (AI) and machine learning technologies also opens up remarkable opportunities for innovation in the set-top box domain. Incorporating AI features, such as personalized content recommendations and voice control capabilities, can significantly elevate user experiences. By leveraging machine learning algorithms to analyze viewer preferences and behaviors, manufacturers can transform the way consumers interact with content, leading to increased engagement and satisfaction.
Moreover, the push for 4K and 8K resolution content paves the way for high-definition set-top box offerings that cater to the growing segment of consumers invested in premium viewing experiences. As content providers continue to produce high-resolution content, there emerges a clear opportunity for manufacturers to create set-top boxes equipped with the technology necessary to support such offerings. This alignment with consumer expectations for superior picture quality can lead to enhanced competitive advantages and increased consumer loyalty.
Market Challenges
While the set-top box market showcases significant potential, it is also confronted with numerous challenges that could impede its development. One of the most pressing challenges is the rapid pace of technological evolution, which can render existing products outdated, requiring constant adaptation and innovation from manufacturers. Staying relevant in a market driven by changing consumer expectations and emerging technologies can place immense pressure on companies, particularly smaller players that may lack the necessary resources for extensive R&D.
The saturation of the current market landscape poses another significant challenge. With a plethora of options available to consumers, distinguishing products and features becomes increasingly difficult. This level of saturation leads to intense competition, where companies must perpetually innovate and invest in marketing strategies to capture and retain consumer interest. In such a competitive environment, profit margins can be adversely affected, impacting overall business sustainability.
Additionally, fluctuations in consumer behavior due to external factors such as economic downturns and changes in disposable income can pose a challenge as well. During periods of economic uncertainty, consumers are likely to postpone discretionary spending on electronic devices like set-top boxes. Thus, market players must navigate these economic cycles strategically to maintain sales and profitability.
Moreover, establishing strong partnerships with content providers and distributors remains complex yet essential. The need for compliance with various licensing and distribution agreements can create additional operational challenges for set-top box manufacturers. Formulating strategic partnerships while ensuring content availability and adherence to regulatory requirements can be resource-intensive and may deter smaller players from entering the market.
05 Industry Trends
Technological Advancements
The Set Top Box (STB) industry is undergoing a significant transformation due to rapid technological advancements. One of the most notable innovations is the integration of artificial intelligence (AI) and machine learning algorithms into STBs. These technologies enable devices to personalize user experiences by analyzing viewing habits and preferences, leading to tailored content recommendations and enhanced user engagement.
Moreover, advancements in 4K and 8K video streaming capabilities are reshaping the viewing experience for consumers. As high-definition content becomes more prevalent, STBs are evolving to support these resolutions, ensuring compatibility with modern televisions. This enhancement not only improves the visual quality of media consumption but also caters to the growing demand for immersive and high-fidelity experiences.
Additionally, the rise of cloud computing has had a profound impact on STB technology. Cloud-based STBs can leverage vast storage and processing capabilities to provide advanced features such as cloud DVR functionality. This allows users to record, store, and access content from anywhere, eliminating the limitations of traditional storage options and enabling greater flexibility in content consumption.
Furthermore, the integration of voice control technology into STBs marks another leap in innovation. With the incorporation of virtual assistants, users can navigate menus, search for content, and control playback simply by using voice commands. This hands-free functionality enhances accessibility and offers a new level of convenience for users, particularly elderly individuals or those with disabilities.
Finally, the convergence of STBs with other devices such as smartphones and tablets is setting new standards in interoperability. Users can now control their STBs via mobile applications, allowing them to remotely manage settings, schedule recordings, and even stream content directly to their mobile devices. This kind of seamless integration helps bridge the gap between traditional television viewing and modern, on-the-go consumption.
Emerging Applications
As technology continues to evolve, so too do the applications for Set Top Boxes. One significant emerging application is the development of interactive content that enhances viewer engagement. STBs are increasingly incorporating features such as polls, quizzes, and interactive advertising that invite users to participate actively rather than passively consume content. This trend is particularly appealing to advertisers looking to create more meaningful connections with audiences.
Another notable application is the implementation of enhanced security features within STBs. As streaming services and digital media consumption grow, so do concerns surrounding data privacy and protection. New STB models are now integrating advanced encryption technologies and secure access controls to safeguard user data, ensuring a secure viewing experience.
Additionally, the advent of augmented reality (AR) and virtual reality (VR) in STB technology is opening up exciting possibilities for immersive content experiences. By allowing users to engage with content in a three-dimensional environment, STBs can enhance gaming, educational programming, and even remote travel experiences. This innovative approach to content consumption provides a new avenue for media creators and marketers to explore.
The health and wellness sector is also witnessing the adoption of STBs, as streaming platforms are increasingly offering content related to fitness and mental well-being. Users can access workout videos, mindfulness sessions, and nutrition guides directly through their STBs, making it easier to maintain a healthy lifestyle from the comfort of their homes.
Lastly, STBs are also adapting to support online gaming applications, acting as dedicated gaming consoles that offer cloud gaming services and gaming subscriptions. This shift not only diversifies the utility of STBs but also caters to the growing demand for at-home gaming experiences, positioning STBs as multifaceted entertainment hubs that can provide a wide range of content beyond traditional television.
Integration in Broadcasting
The integration of Set Top Boxes within the broadcasting ecosystem is becoming increasingly complex yet crucial. One of the primary trends is the shift toward IP-based broadcasting, where traditional satellite and cable systems are increasingly complemented by Internet Protocol (IP) solutions. This transition allows broadcasters to deliver content over the internet, in real-time, and often renders STBs more versatile and connected in the process.
Furthermore, the integration of Over-The-Top (OTT) services with traditional broadcasting is re-defining how content is consumed. STBs are now designed to combine broadcast channels with OTT platforms, enabling users to access a wider array of content seamlessly. This hybrid model not only enhances content discoverability but also provides a competitive edge in enticing viewers who prefer internet-based services.
The role of STBs in facilitating targeted advertising is also gaining traction in broadcast integration. With the ability to collect and analyze viewer data, STBs can support personalized advertising strategies, allowing broadcasters to tailor ads to specific demographics. This capability creates new revenue streams for broadcasters and provides more relevant experiences for viewers.
Moreover, as content fragmentation becomes a norm, the focus on universal user interfaces (UI) is becoming paramount. STBs are now evolving to support consistent and intuitive navigation across various platforms—whether they be native broadcasting channels or third-party streaming services. This unified experience simplifies user interactions and helps retain viewer engagement over time.
Finally, advancements in broadcast standards are paving the way for improvements in STB functionality. The adoption of standards such as ATSC 3.0 in the U.S. enhances the capabilities of STBs, enabling features such as 4K transmission, improved audio formats, and data broadcasting. This not only enriches the viewing experience but also reinforces the relevance of STBs in modern broadcasting setups.
06 Regulatory Landscape
Overview of Regulatory Framework
The regulatory framework surrounding set-top boxes (STBs) is complex and multifaceted, encompassing various government agencies at both federal and regional levels. Primarily, the Federal Communications Commission (FCC) in the United States plays a central role by establishing rules that dictate how service providers and manufacturers must operate. These regulations often focus on ensuring competition in the market, protecting consumer rights, and facilitating innovation while also ensuring fair access to content. Furthermore, regulations can vary significantly across different countries and regions, reflecting the unique market dynamics and policy goals of each area.
In addition to the FCC, other regulatory bodies and laws contribute to the STB landscape. This includes intellectual property laws that protect the technology behind STBs, as well as telecommunications regulations that govern how service providers deliver content to consumers. The convergence of broadband and television services has also led to increased scrutiny and regulation, with regulators around the world grappling with how to best adapt existing laws to the changing media landscape. As technology evolves, there exists an ongoing debate about the appropriateness of existing regulations and the need for new policies to cater to innovations like streaming services and on-demand video content.
Industry standards, such as the Advanced Television Systems Committee (ATSC) standards in the U.S. and the Digital Video Broadcasting (DVB) standards in Europe, further delineate the operational landscape for STBs. These standards establish protocols to ensure compatibility and performance of STBs across different platforms and services. Moreover, certification requirements often mandate that devices meet specific technical criteria, enhancing overall user experience while ensuring compliance with regulatory expectations. The interplay of these regulations and standards ultimately shapes how manufacturers design and develop STBs, influencing market competitiveness.
Data privacy regulations are also increasingly relevant in the STB regulatory framework. As STBs become more integrated with internet connectivity and smart home technologies, concerns regarding consumer data protection intensify. Several jurisdictions have enacted or are in the process of developing laws to safeguard users against unauthorized data usage and ensure transparency about how data is collected and shared. Compliance with these regulations is critical for manufacturers and service providers, as violations can lead to severe penalties and damage to consumer trust.
Lastly, stakeholders in the ecosystem, including content providers, device manufacturers, and consumer advocacy groups, play a crucial role in shaping the regulatory environment. Their feedback, lobbying efforts, and compliance initiatives significantly influence the development and refinement of regulatory frameworks. Continuous engagement among these parties is necessary to ensure that regulations foster a competitive marketplace while serving consumers' best interests. Therefore, the regulatory landscape of set-top boxes is not static; it evolves in response to technological advancements, market changes, and consumer demands.
Impact of Regulatory Policies on Market Growth
The impact of regulatory policies on the market growth of set-top boxes is substantial, influencing various aspects of the industry, from innovation and competition to pricing and consumer adoption. One fundamental way these policies affect growth is by establishing standards that promote competition among service providers. By preventing monopolistic practices, policies can encourage the entry of new players into the market, leading to a wider variety of products and services available to consumers. Increased competition ultimately drives technological advancements, pushing manufacturers to innovate and enhance their offerings.
Moreover, regulatory frameworks that support interoperability are essential for market growth. Regulations that require compatibility between devices enable consumers to access multiple services through a single set-top box, reducing friction in the user experience. This not only benefits consumers by providing them with more choices but also allows content providers to reach broader audiences. As seamless integration of services becomes increasingly important, regulations that promote interoperability can lead to higher adoption rates of devices and services, resulting in substantial market growth.
Another critical component is how regulatory policies address consumer data protection, a growing concern in today’s digital age. Regulations that enforce strict data protection guidelines safeguard consumer privacy and enhance trust in STB products. Trust is a key factor influencing consumer purchasing decisions; therefore, strengthened privacy protections can lead to greater market adoption of STBs that comply with these regulations. As more consumers feel secure in how their data is handled, they are more likely to invest in advanced set-top box technologies, positively impacting overall market growth.
Additionally, the financial implications of regulatory policies can directly affect market dynamics. Regulations imposing tariffs on imported STBs or components can lead to increased costs for manufacturers, possibly resulting in higher prices for consumers. Conversely, tax incentives and subsidies aimed at promoting specific technologies or encouraging innovation can lower retail prices and stimulate market demand. Policymakers must carefully balance these financial regulations to ensure they do not stifle market growth while supporting the development of advanced technologies.
The global nature of the STB market cannot be overlooked when considering regulatory impacts. Differences in regulatory policies across countries can create significant barriers to entry for manufacturers looking to operate internationally. Companies must navigate the complexities of compliance in various markets, which can hinder their ability to expand and innovate. Policymakers are challenged to harmonize regulations to facilitate international trade and support the global STB market's growth while also addressing local consumer needs and technological advancements.
07 Impact of COVID-19 on the Artificial Intelligence Market
Short-term and Long-term Implications
The COVID-19 pandemic has had profound implications on various facets of the economy, and the set-top box market is no exception. In the short term, we observed an unprecedented surge in demand as consumers sought more entertainment options during lockdowns. With theaters closed and outdoor activities limited, many households turned to streaming services for content consumption, prompting an immediate spike in set-top box sales. This surge could be attributed to consumers looking to enhance their home viewing experience, driving manufacturers to ramp up production to meet this newfound demand.
Conversely, the long-term implications of this surge may not be as favorable. As the pandemic situation stabilizes and the world gradually reopens, it is anticipated that consumers may revert to their previous habits, potentially stabilizing or even decreasing the demand for set-top boxes. This adjustment might lead to a market correction, where manufacturers and service providers need to strategize and innovate to maintain relevance in a changing landscape.
Another critical factor in the long-term implication is the evolving technology landscape. With advancements in smart TVs and streaming devices that offer similar functionalities without the need for a set-top box, the market may face sustained pressure. Consumers might opt for integrated solutions that eliminate the need for multiple devices, leading to an overall decline in set-top box penetration in the long term.
Moreover, the economic impact of the pandemic has contributed to a shift in consumer spending habits. Individuals and households are now more cautious with their expenditures, leading to a potential decrease in the premium set-top box market, as consumers prioritize budget-friendly options. Service providers might need to consider this shift in consumer behavior and adjust their offerings accordingly to cater to a more price-sensitive market.
In addition, the rise of subscription-based streaming services has created a more competitive environment for set-top box providers. Companies must innovate their business models and explore partnerships with popular streaming platforms to enhance their products, ensuring they are equipped to keep up with changing consumer demands and preferences in a post-pandemic world.
Shift in Market Dynamics
The pandemic has catalyzed a significant shift in the market dynamics surrounding set-top boxes. Companies that relied heavily on traditional cable revenue streams found themselves at a crossroads, as the demand for linear cable TV subscriptions experienced a notable decline. Consumers increasingly favored affordable streaming services over traditional models, forcing set-top box manufacturers to rethink their market strategies and value propositions.
As a result, we observed an increased emphasis on integration and compatibility with various streaming platforms within the set-top box landscape. Manufacturers began to forge partnerships and collaborations with the likes of Netflix, Hulu, and Disney+, enhancing the capabilities of their devices while staying competitive in a rapidly evolving market. This shift not only benefits consumers but also enables manufacturers to diversify their offerings and tap into new revenue streams.
Furthermore, the pandemic expedited the transition towards cloud-based solutions and smart home integration. Set-top boxes are evolving from mere streaming devices to central hubs that manage diverse smart home functionalities, appealing to tech-savvy consumers. This transition signifies a significant evolution in the role of set-top boxes, further impacting the competitive landscape as companies strive to differentiate themselves through innovative features.
The increased competition from gaming consoles is yet another dynamic at play. With many consumers seeking comprehensive entertainment solutions, gaming consoles like the PlayStation and Xbox have begun to offer extensive streaming capabilities and are now competing directly with traditional set-top boxes. This competition intensifies the pressure on set-top box manufacturers to innovate and provide value-added features that entice consumers to stick to dedicated devices.
Ultimately, the changes in market dynamics triggered by the pandemic have required set-top box manufacturers to adopt agile business approaches. They must remain attuned to consumer preferences, adapt to technological advancements, and explore creative business models to stay relevant in a post-COVID-19 world.
Consumer Behavior
The COVID-19 pandemic has markedly altered consumer behavior, especially concerning how people interact with media and technology. As lockdown measures persisted, audiences experienced a profound cultural shift, placing an increased emphasis on at-home entertainment options. Consequently, this led to greater usage of streaming services and demand for devices like set-top boxes that facilitate seamless access to such content.
During this period, the flexibility of viewing content from the comfort of home became more appealing than traditional viewing methods. Consumers became more discerning in their choices and sought devices that offered diverse content, user-friendly interfaces, and enhanced features. This evolution in behavior requires set-top box companies to prioritize understanding consumer preferences, investing in research and development to align their offerings with the new demands of the audience.
Moreover, the pandemic has influenced the demographics of consumers engaging with set-top box technology. Remote work arrangements and educational shifts brought new audience segments into the fold. Families with children turned to educational content and engaging storytelling through streaming platforms, influencing their purchasing decisions towards multifunctional devices that cater to all age groups, further expanding the target market for set-top boxes.
The increasing popularity of binge-watching trends also played a significant role in behavioral changes. Viewers began to favor on-demand content consumption instead of scheduled programming. Set-top boxes that offer advanced features, such as personalized recommendations based on viewing habits, gained traction amongst consumers as they sought to replicate the cinema-like experience at home.
In conclusion, the pandemic catalyzed a shift in consumer behavior that aligns more closely with the on-demand viewing landscape rather than traditional media consumption patterns. Understanding these behavioral changes is crucial for set-top box manufacturers looking to innovate and capture market share in this rapidly transforming environment.
08 Porter's Five Forces Analysis
Bargaining Power of Suppliers
The bargaining power of suppliers in the set-top box market plays a significant role in shaping the dynamics of the industry. Suppliers hold considerable power in situations where they provide unique components, technologies, or software that are essential for the functionality of set-top boxes. The industry predominantly relies on a limited number of suppliers for critical components such as chipsets, tuners, and connectors. This concentration of supply increases the leverage that these suppliers have, allowing them to demand higher prices and more favorable terms, which can affect the overall profitability of manufacturers.
Moreover, the technological advancement in chips and software creates a high entry barrier for new suppliers, often leaving existing suppliers in a dominant position. As set-top box manufacturers require constant innovation to meet consumer demands and stay ahead of competitors, they become dependent on these suppliers for cutting-edge technologies. This interdependence can lead to suppliers exerting influence over manufacturers, thereby shaping the pricing and availability of essential components.
Additionally, the level of switching costs also contributes to the bargaining power of suppliers. If manufacturers are using proprietary technology or software, switching to alternative suppliers can involve significant costs and risks, such as compatibility issues and delays in production. This lack of flexibility results in manufacturers being more inclined to comply with supplier demands, further enhancing suppliers' negotiating position.
Another critical factor is the trend towards vertical integration. Some larger brands may seek to reduce their dependence on external suppliers by developing in-house capabilities. While this could decrease suppliers' power in the long run, the process of establishing these capabilities could be costly and time-consuming, indicating that in the short term, the bargaining power of suppliers remains robust.
In summary, the overall bargaining power of suppliers in the set-top box market is relatively high due to the concentration of suppliers, the importance of specialized components, the existence of switching costs, and the dependency on innovation. This dynamic has significant implications for manufacturers, as their operational flexibility and profit margins are closely tied to the strategies employed by their suppliers.
Bargaining Power of Buyers
In the set-top box market, the bargaining power of buyers is an influential force affecting pricing strategies and competition among manufacturers. With a wide array of options, consumers have the ability to switch between different service providers and devices with relative ease. This availability of alternatives empowers buyers, as they can demand better quality, features, and pricing. Consequently, manufacturers are pressured to offer competitive pricing and advanced technology to retain existing customers and attract new ones.
The rise of streaming services and smart TV technologies has significantly impacted consumer expectations. As buyers become more knowledgeable, their expectations for seamless integration between various devices and platforms have risen. This transition has made consumers less reliant on traditional set-top box services, thereby increasing their bargaining power. Buyers now expect value for their investments, pushing manufacturers to innovate continuously and offer features that cater to changing consumer preferences.
Furthermore, as the market expands and diversifies, buyers are equipped with tools to compare products easily, which enhances their ability to negotiate better terms. User reviews, technological specifications, and price comparisons found online allow buyers to make informed decisions. This change in access to information increases consumer empowerment, making it crucial for manufacturers to focus on delivering superior customer service and product quality to maintain customer loyalty.
As a result of these transformations, manufacturers in the set-top box market find themselves compelled to engage in promotional activities and discounted offers to appeal to price-sensitive consumers. As they strive to stand out in a crowded marketplace, manufacturers must also invest in marketing strategies that highlight the unique selling propositions of their products to differentiate themselves from competitors.
In conclusion, the bargaining power of buyers in the set-top box market is high due to the availability of alternatives, increasing consumer expectations, and access to information that enables them to make informed decisions. This high bargaining power necessitates manufacturers to prioritize customer satisfaction and continuous innovation to maintain their competitive edge in a dynamic market.
Threat of New Entrants
The threat of new entrants in the set-top box market is a pivotal factor that influences the competitive landscape. While the market has traditionally been dominated by established players boasting brand loyalty and experience, the continuous evolution of technology creates a window for new entrants to disrupt the industry. New technologies, such as cloud-based services and connected devices, have lowered entry barriers, enabling startups to introduce innovative solutions that challenge incumbents.
However, entering the set-top box market is not without challenges. New entrants must grapple with significant capital requirements due to rigorous research and development spending for technology and compliance with regulatory standards. Additionally, newcomers need to establish distribution channels and form relationships with content providers, which can be both daunting and resource-intensive. These factors create a dual-edged sword; while the technological advancements may foster new entrants, the complexities associated with entry can deter many from pursuing market participation.
Brand recognition and customer loyalty also play crucial roles in the threat level posed by new entrants. Established brands have built substantial market presence and trust among consumers, resulting in formidable barriers to entry for new companies. New players not only need to develop a compelling product that stands out in terms of features and price but also need to invest heavily in marketing to build brand awareness and recognition—a challenge not easily overcome in a competitive market.
Moreover, the ongoing trend towards consolidation within the industry can deter new entrants, as established companies acquire promising startups for their innovations, thus eliminating potential competition. This trend creates an environment where new entrants might hesitate to invest in the set-top box market if they perceive that their innovations could easily be absorbed by larger competitors.
In conclusion, while the threat of new entrants in the set-top box market exists due to technological evolution and changing consumer preferences, significant barriers such as capital requirements, established brand loyalty, distribution networks, and the trend of consolidation present daunting challenges. Consequently, the market remains relatively secure for current incumbents, though they must be mindful of emerging disruptions that could stem from innovation-driven newcomers.
Threat of Substitutes
The threat of substitutes in the set-top box market is a critical force that shapes competitive dynamics. With the proliferation of alternative video delivery platforms—such as streaming services, smart TVs, and mobile devices—the traditional set-top box is increasingly vulnerable to being supplanted by these substitutes. The rise of content-on-demand and the growing popularity of cord-cutting have fundamentally altered how consumers access and enjoy media content, making substitutes more appealing than ever.
Streaming platforms like Netflix, Hulu, and Amazon Prime Video provide an extensive library of content that can be accessed at any time, allowing consumers to enjoy flexibility in viewing preferences. This convenience and variety enable consumers to forgo traditional cable subscriptions in favor of direct streaming services, effectively positioning these platforms as formidable substitutes to traditional set-top box services. The value proposition of these alternatives increases as they often offer competitive pricing models, often without the additional fees associated with traditional cable services.
Furthermore, smart TVs are equipped with built-in streaming capabilities, rendering external set-top boxes redundant for many consumers. As consumers increasingly adopt smart televisions and mobile devices, the need for an additional piece of hardware diminishes, which in turn exacerbates the threat posed by these substitutes. As a result, set-top box manufacturers are compelled to rethink their product offerings, focusing on features that enhance convergence with streaming applications and ensuring their devices remain relevant in the evolving media landscape.
The impact of social and cultural trends should not be overlooked either. As consumer behaviors shift toward digital-first experiences, the demand for seamless access to online content continues to rise. In this context, the appeal of the traditional set-top box diminishes in contrast to the experiences offered by substitutes that provide universal access to media at a lower cost. This trend also informs manufacturers' strategies as they must justify the value they provide in an increasingly crowded digital marketplace.
In summary, the threat of substitutes in the set-top box market is substantial as new alternatives gain traction among consumers. The increasing adoption of streaming services and smart devices has forced manufacturers to adapt and innovate continuously to remain competitive. To mitigate this risk, set-top box manufacturers must focus on integrating new technologies, redefining their value propositions, and exploring partnerships that enhance their relevance in an age characterized by rapid technological change.
Competitive Rivalry
The competitive rivalry within the set-top box market is intense, driven by a multitude of established players vying for market share. Major corporations, such as Roku, Apple, Amazon, and traditional cable companies, engage in relentless competition, leading to continuous innovations and price adjustments. This fierce rivalry is characterized by rapid technological advancements and evolving consumer preferences, dictating the pace of competition and product development in the industry.
As the market evolves, companies are pushed to differentiate their offerings to capture consumer attention. Manufacturers are increasingly incorporating innovative features and functionalities such as voice recognition, integrated content discovery, and user-friendly interfaces to provide a more engaging experience. The intensity of competition often translates into aggressive marketing campaigns, promotional pricing, and the constant introduction of new products intended to entice customers.
Moreover, this competitive environment is exacerbated by the diversification of market segments. The rise of niche markets—such as gaming consoles with streaming capabilities, hybrid devices, and internet-based TV services—creates additional layers of rivalry. Each segment offers unique opportunities and challenges, compelling existing players to recalibrate their strategies and invest in new technologies that cater to varying consumer demands.
The threat of price wars also permeates this competitive landscape. To attract and retain customers, manufacturers might engage in pricing strategies that can erode profit margins in the long run. This intensity of competition necessitates innovation not only in terms of product development but also in pricing and service models to ensure sustainable growth amidst fierce contenders.
In conclusion, the level of competitive rivalry in the set-top box market is high due to the presence of many capable competitors, the need for differentiation, and the diversification of market segments. For manufacturers to thrive in this environment, they must commit to ongoing innovation, effective marketing strategies, and an acute understanding of consumer behavior to gain a competitive edge in a continuously evolving market.
09 Key Insights and Findings
Market Overview
The Set Top Box (STB) market has been undergoing significant transformations in recent years, driven by advancements in technology and shifting consumer preferences. Once dominated by basic cable functionalities, modern set-top boxes now serve as central hubs for a variety of digital entertainment services. The market has expanded to include features such as streaming services, video on demand (VOD), and integration with smart home devices, leading to enhanced user experiences.
With the rise of Over-The-Top (OTT) content providers like Netflix, Amazon Prime, and Hulu, traditional cable companies have started to adapt and innovate. This shift has propelled manufacturers to incorporate advanced functionalities like voice control, 4K streaming capabilities, and greater compatibility with various operating systems. Additionally, the demand for high-definition and ultra-high-definition content has further encouraged the development of more sophisticated STB models.
Geographically, the market is witnessing varied growth patterns. For instance, North America holds a significant market share due to its established broadband infrastructure and high rates of cable subscription. Meanwhile, regions such as Asia-Pacific are experiencing rapid growth attributed to the rising middle class, increased adoption of internet services, and a growing appetite for digital content. This regional divergence presents both challenges and opportunities for manufacturers as they navigate local consumer behaviors and preferences.
Moreover, the competitive landscape is progressively evolving, with multiple players entering the space. Global tech giants are not only competing with traditional cable providers, but also with each other. As a result, the convergence of technologies is creating an ecosystem that allows for seamless integration between STBs, smart TVs, and mobile devices, enhancing overall consumer engagement with the media.
The ongoing innovation in software and hardware for set-top boxes is also noteworthy. Manufacturers are investing heavily in R&D to enhance user interface (UI) experiences and introduce Artificial Intelligence (AI) features that provide personalized content recommendations. As such, STBs are evolving beyond passive content consumption devices into active assistants catering to the specific tastes of users.
Technological Advancements
The technological landscape of the set-top box market is rapidly evolving, characterized by significant advancements that have shaped the capabilities of these devices. One of the most prominent innovations is the incorporation of streaming services, which provide immediate access to vast libraries of content from various providers. This shift reflects the changing consumer behavior, wherein viewers are increasingly favoring on-demand content over traditional linear broadcasting.
Moreover, the integration of Artificial Intelligence (AI) technologies in STBs has transformed how users interact with their devices. AI algorithms can analyze viewing habits and preferences, leading to tailored content recommendations that enhance user experience. This capability not only retains existing subscribers but also aids providers in attracting new users by showcasing personalized viewing options.
Another significant advancement is the introduction of 4K and 8K resolution support in set-top boxes. As display technology continues to improve, consumers are seeking devices capable of delivering high-definition content to match modern television displays. Manufacturers are focusing on developing STBs that support these high-resolution formats, thus aligning with consumer demand for better visual quality and immersive viewing experiences.
Additionally, improved connectivity options such as wireless streaming and HDMI support have made it easier for consumers to incorporate STBs into their existing entertainment systems. The advancement of Wi-Fi technologies, such as Wi-Fi 6, allows for higher bandwidths and better streaming quality, enabling multi-user households to enjoy uninterrupted services concurrently without buffering.
The growth in integration with smart home ecosystems is another notable trend. Modern STBs can now connect seamlessly with other smart devices, including voice assistants and smart TVs. This interoperability not only enhances user convenience but also allows for innovative features such as voice commands and remote access. As smart homes continue to gain popularity, set-top boxes are evolving to become integral components of comprehensive home entertainment setups.
Market Drivers
The growth of the set-top box market can be attributed to several key drivers that are influencing consumer adoption and shaping industry trends. One of the primary drivers is the increasing demand for on-demand content consumption. As more consumers gravitate towards personalized viewing experiences, the appeal of set-top boxes that aggregate various streaming platforms and content libraries has surged. This shift in viewing behavior is driving demand for STBs that offer easy access to both traditional and digital media.
Additionally, the proliferation of high-speed internet across the globe has facilitated seamless streaming capabilities. With improved bandwidth and reliable connectivity, consumers are less likely to experience interruptions while streaming content. This enhanced internet accessibility is a pivotal factor encouraging the adoption of advanced set-top boxes that can handle more data and deliver superior quality content, including 4K and HDR options.
The growing inclination towards cord-cutting is also a significant catalyst for the STB market. As consumers seek alternatives to traditional cable packages, many are opting for streaming services that offer similar or superior content at lower prices. Set-top boxes have emerged as essential tools for individuals looking to tailor their entertainment experience by integrating multiple OTT services into a single platform.
Moreover, the demand for smart home integration is pushing set-top box manufacturers to innovate and enhance product offerings. As consumers increasingly adopt smart home technologies, STBs that can easily connect and interact with other smart devices are in higher demand. This integration not only improves convenience but also elevates the overall user experience by providing a cohesive smart ecosystem.
Lastly, the rise of mobile streaming is contributing to the growth of the STB market. Consumers are now accustomed to accessing content on various devices, including smartphones and tablets. Set-top boxes that support multi-device streaming and synchronization are particularly appealing, as they allow users to enjoy their favorite content across different screens without disruption.
Challenges
Despite the robust growth and evolution of the set-top box market, several challenges persist that could hinder future progress. One of the most pressing issues is the intense competition within the industry. With numerous players vying for market share, manufacturers must continually innovate and differentiate their products to maintain relevance. This competitive pressure can result in downward pricing strategies, impacting profitability for many companies.
Moreover, the rapid pace of technological advancement presents a dual-edged sword. While it propels innovation, it also requires consistent investment in research and development. Companies that fail to keep up with emerging technologies risk becoming obsolete. This creates pressure on manufacturers to deliver cutting-edge products while managing costs effectively.
Another challenge is the fragmentation of content across various platforms. Consumers often face difficulties in navigating multiple services, which can lead to frustration and dissatisfaction. Set-top box manufacturers are tasked with finding ways to streamline content access and provide a unified interface that simplifies the user experience. This challenge is particularly significant as new OTT platforms continue to emerge.
Additionally, the adoption of set-top boxes in certain markets may be hindered by socioeconomic factors. In regions with limited internet infrastructure or higher costs associated with broadband access, consumers may be reluctant to invest in high-tech devices. Manufacturers will need to consider these limitations and devise strategies to penetrate markets where consumers may have less disposable income.
Lastly, privacy concerns surrounding data collection and user tracking are becoming increasingly prominent. As set-top boxes integrate capabilities to learn user preferences and behaviors, apprehensions regarding data security and user privacy arise. Companies must address these concerns transparently to retain consumer trust and ensure compliance with evolving regulations on data protection.
Future Outlook
The future outlook for the set-top box market is optimistic, driven by continued technological advancements and evolving consumer needs. As the demand for personalized content grows, manufacturers are expected to enhance the functionality of STBs to deliver more customized experiences. This could include improved AI algorithms and content curation capabilities that cater to individual viewing habits.
Furthermore, the integration of virtual reality (VR) and augmented reality (AR) within the entertainment landscape may present new avenues for growth. As consumer interest in immersive experiences increases, set-top boxes that can support VR and AR content could capture a significant share of the market. This shift would compel manufacturers to invest in technologies that enable such capabilities.
Additionally, the expansion of 5G networks is set to revolutionize the way consumers access content. With faster and more reliable internet connections, set-top boxes could leverage this technology to stream high-quality content without latency issues. This technological upgrade may encourage even more users to adopt STBs, as seamless access to a variety of media formats becomes the norm.
Collaboration and partnerships between STB manufacturers and content providers are also likely to increase. By joining forces, these entities can create unique offerings that enhance the overall viewing experience and attract diverse user segments. Such collaborations could encompass bundling content packages with set-top boxes or exclusive access to specific shows or channels.
In conclusion, as the set-top box market continues to evolve alongside changing technologies and consumer preferences, it will remain a dynamic sector with promising opportunities. By addressing existing challenges and capitalizing on emerging trends, manufacturers can navigate the complexities of this competitive landscape and secure a foothold in the future of digital entertainment.
10 Technology Overview
Streaming Technology
The set top box (STB) market has undergone significant transformations in recent years, primarily due to advancements in streaming technology. This evolution has allowed consumers to access content from various sources, including cable networks, internet services, and on-demand platforms. The backbone of this technology is the efficient decoding and rendering of video data, which is crucial for providing quality streaming experiences. Highly sophisticated codecs are used to compress video data, ensuring high-quality streaming even over limited bandwidth connections.
Moreover, the integration of adaptive bitrate streaming technology has revolutionized how video content is delivered. This technique enables the STB to adjust the quality of the stream in real-time based on the user's internet speed and bandwidth conditions. This adaptability is particularly important given the varying connection qualities experienced by users across different geographical locations and service providers. By automatically selecting the best bitrate for streaming, adaptive technology minimizes buffering and enhances user satisfaction.
Additionally, cloud-based streaming services have significantly impacted the set top box market. With the rise of platforms like Netflix, Hulu, and Amazon Prime Video, STBs have evolved from simple cable tuners to comprehensive entertainment hubs that aggregate streaming services. These devices now often come equipped with built-in Wi-Fi and robust processing power, allowing users to navigate multiple platforms seamlessly. As a result, consumers enjoy a unified interface, where they can switch between live television, recorded shows, and on-demand content with ease.
Another important aspect of streaming technology is the move towards 4K and HDR (High Dynamic Range) streaming capabilities. As more content is produced in these high-definition formats, set top boxes must be equipped with sufficient technological capability to handle the increased data requirements. This involves not only advanced decoding capabilities but also enhanced HDMI standards to ensure optimal video and audio quality. The advent of 4K content has set new standards for consumer expectations, pushing manufacturers to innovate and deliver devices that cater to these higher resolution formats.
In conclusion, streaming technology represents a significant portion of the set top box market and influences the way consumers interact with their viewing habits. As content delivery and consumption patterns continue to evolve, it is crucial for device manufacturers to stay ahead by adopting the latest technologies. The success of STBs hinges on their ability to provide seamless, high-quality streaming experiences, paving the way for further innovations in the realm of home entertainment.
Interactive TV Technology
Interactive TV technology has emerged as a critical component of the set top box ecosystem, enhancing the viewing experience by allowing viewers to engage with content actively. This form of interactivity can range from simple functionalities, like pausing or rewinding live television, to more complex interactions that involve real-time voting during live shows, selection of alternate camera angles, and personalized content suggestions. As a result, interactive TV allows users to customize their viewing experience and engage with content in deeper ways.
One of the notable advancements in this domain is the implementation of HbbTV (Hybrid Broadcast Broadband TV) technology. HbbTV combines traditional broadcast methods with internet connectivity, enabling broadcasters to deliver additional content and services alongside regular programming. Viewers can interact with their televisions by accessing supplementary information, such as actor biographies, trivia about the show, as well as interactive advertisements. This convergence of broadcasting and the internet offers an enriched viewing experience that can enhance viewer engagement and solidify customer loyalty.
User-generated content also plays a significant role in interactive television. Many set top boxes now provide the ability for users to create and share their own content through social media channels or within built-in apps. This capability encourages user participation and turns passive viewers into content creators. Not only does this fill the content gap, but it also enhances community engagement, as viewers can share their opinions, participate in discussions, and interact with their favorite shows and networks.
Additionally, interactive TV technology allows for the integration of gaming and social features directly into the viewing experience. Many modern STBs provide an assortment of games and social media applications that can be accessed alongside regular television content. Features such as synchronized viewing—where friends can watch a show together and chat in real-time—represent a growing trend in interactive television. This shift recognizes the importance of social interaction within the viewing experience and aligns with broader trends in digital media consumption.
In summary, interactive TV technology is revolutionizing how consumers engage with the content on their set top boxes. As user expectations evolve, there is a greater demand for interactivity and personalization, pushing manufacturers to integrate more sophisticated technologies. The future of STBs will likely witness even more enhanced interactivity, as they become not only a means of content consumption but also a platform for engagement and community building.
User Interface and Experience Technologies
The user interface (UI) and user experience (UX) technologies used in set top boxes have emerged as focal points in determining the overall effectiveness of these devices. A well-designed UI is crucial for enhancing user engagement, as it facilitates seamless navigation through an array of content and services. Modern STBs are leveraging advanced UX methodologies to ensure that viewers can intuitively find and access their preferred content without unnecessary complexity or frustration.
One trend in user interface design is the move towards voice control and smart assistants. Many STBs are now incorporating voice recognition technology, enabling users to search for content using natural language commands. This feature simplifies the search process, making it easier for viewers to discover new shows or navigate through vast content libraries. Furthermore, the integration of AI-driven algorithms allows for a more personalized viewing experience, where content recommendations can evolve based on user behavior and preferences.
Additionally, touch and gesture-based controls are becoming more prevalent in the STB market. Instead of relying solely on traditional remote controls, some devices offer touchscreen interfaces or gesture recognition capabilities that allow users to interact with their televisions in more engaging ways. This approach not only increases user convenience but also provides an immersive experience that enhances interaction with the content. As technology advances, we could see increasingly innovative ways to interact with set top boxes through natural user interfaces.
A key focus of UI and UX technology is the importance of cross-platform compatibility. In a landscape where users access content from multiple devices—such as smartphones, tablets, and smart TVs—the need for a consistent user experience across these platforms is imperative. Set top boxes are now designed with responsive interfaces that adapt to various screen sizes and input methods. By maintaining UI consistency, users can move seamlessly between devices without having to relearn functionality, ultimately improving satisfaction.
In conclusion, user interface and experience technologies play a vital role in the success of set top boxes. As consumer preferences continue to shift toward convenience, personalization, and interactivity, manufacturers must prioritize innovative UI/UX design to remain competitive. The ability to create engaging and user-friendly interfaces will determine the acceptance and utilization of set top boxes in households worldwide, shaping the future of digital content consumption.
11 Set Top Box Market, By Product
GLOBAL ARTIFICIAL INTELLIGENCE MARKET SIZE, BY PRODUCT, 2023-2030 (USD BILLION)
By Product | 2023 | 2024 | 2025 | 2026 | 2027 | 2028 | 2029 | 2030 | CAGR (2023-2030) |
---|---|---|---|---|---|---|---|---|---|
Forecast | |||||||||
Cable Set-Top Boxes | xx | xx | xx | xx | xx | xx | xx | xx | xx |
Satellite Set-Top Boxes | xx | xx | xx | xx | xx | xx | xx | xx | xx |
IPTV Set-Top Boxes | xx | xx | xx | xx | xx | xx | xx | xx | xx |
Smart Set-Top Boxes | xx | xx | xx | xx | xx | xx | xx | xx | xx |
12 Set Top Box Market, By Application
GLOBAL ARTIFICIAL INTELLIGENCE MARKET SIZE, BY APPLICATION, 2023-2030 (USD BILLION)
By Application | 2023 | 2024 | 2025 | 2026 | 2027 | 2028 | 2029 | 2030 | CAGR (2023-2030) |
---|---|---|---|---|---|---|---|---|---|
Forecast | |||||||||
Entertainment | xx | xx | xx | xx | xx | xx | xx | xx | xx |
Education | xx | xx | xx | xx | xx | xx | xx | xx | xx |
Gaming | xx | xx | xx | xx | xx | xx | xx | xx | xx |
Surveillance | xx | xx | xx | xx | xx | xx | xx | xx | xx |
13 Set Top Box Market, By Deployment Mode
14 Set Top Box Market, By End-User Industry Overview
GLOBAL ARTIFICIAL INTELLIGENCE MARKET SIZE, BY END-USER INDUSTRY, 2023-2030 (USD BILLION)
By End-User Industry | 2023 | 2024 | 2025 | 2026 | 2027 | 2028 | 2029 | 2030 | CAGR (2023-2030) |
---|---|---|---|---|---|---|---|---|---|
Forecast | |||||||||
Residential | xx | xx | xx | xx | xx | xx | xx | xx | xx |
Commercial | xx | xx | xx | xx | xx | xx | xx | xx | xx |
Government | xx | xx | xx | xx | xx | xx | xx | xx | xx |
15 By Region
NORTH AMERICA ARTIFICIAL INTELLIGENCE MARKET SIZE, BY PRODUCT, 2023-2030 (USD BILLION)
By Product | 2023 | 2024 | 2025 | 2026 | 2027 | 2028 | 2029 | 2030 | CAGR (2023-2030) |
---|---|---|---|---|---|---|---|---|---|
Forecast | |||||||||
Cable Set-Top Boxes | xx | xx | xx | xx | xx | xx | xx | xx | xx |
Satellite Set-Top Boxes | xx | xx | xx | xx | xx | xx | xx | xx | xx |
IPTV Set-Top Boxes | xx | xx | xx | xx | xx | xx | xx | xx | xx |
Smart Set-Top Boxes | xx | xx | xx | xx | xx | xx | xx | xx | xx |
NORTH AMERICA ARTIFICIAL INTELLIGENCE MARKET SIZE, BY APPLICATION, 2023-2030 (USD BILLION)
By Application | 2023 | 2024 | 2025 | 2026 | 2027 | 2028 | 2029 | 2030 | CAGR (2023-2030) |
---|---|---|---|---|---|---|---|---|---|
Forecast | |||||||||
Entertainment | xx | xx | xx | xx | xx | xx | xx | xx | xx |
Education | xx | xx | xx | xx | xx | xx | xx | xx | xx |
Gaming | xx | xx | xx | xx | xx | xx | xx | xx | xx |
Surveillance | xx | xx | xx | xx | xx | xx | xx | xx | xx |
NORTH AMERICA ARTIFICIAL INTELLIGENCE MARKET SIZE, BY END-USER INDUSTRY, 2023-2030 (USD BILLION)
By End-User Industry | 2023 | 2024 | 2025 | 2026 | 2027 | 2028 | 2029 | 2030 | CAGR (2023-2030) |
---|---|---|---|---|---|---|---|---|---|
Forecast | |||||||||
Residential | xx | xx | xx | xx | xx | xx | xx | xx | xx |
Commercial | xx | xx | xx | xx | xx | xx | xx | xx | xx |
Government | xx | xx | xx | xx | xx | xx | xx | xx | xx |
USA ARTIFICIAL INTELLIGENCE MARKET SIZE, BY PRODUCT, 2023-2030 (USD BILLION)
By Product | 2023 | 2024 | 2025 | 2026 | 2027 | 2028 | 2029 | 2030 | CAGR (2023-2030) |
---|---|---|---|---|---|---|---|---|---|
Forecast | |||||||||
Cable Set-Top Boxes | xx | xx | xx | xx | xx | xx | xx | xx | xx |
Satellite Set-Top Boxes | xx | xx | xx | xx | xx | xx | xx | xx | xx |
IPTV Set-Top Boxes | xx | xx | xx | xx | xx | xx | xx | xx | xx |
Smart Set-Top Boxes | xx | xx | xx | xx | xx | xx | xx | xx | xx |
USA ARTIFICIAL INTELLIGENCE MARKET SIZE, BY APPLICATION, 2023-2030 (USD BILLION)
By Application | 2023 | 2024 | 2025 | 2026 | 2027 | 2028 | 2029 | 2030 | CAGR (2023-2030) |
---|---|---|---|---|---|---|---|---|---|
Forecast | |||||||||
Entertainment | xx | xx | xx | xx | xx | xx | xx | xx | xx |
Education | xx | xx | xx | xx | xx | xx | xx | xx | xx |
Gaming | xx | xx | xx | xx | xx | xx | xx | xx | xx |
Surveillance | xx | xx | xx | xx | xx | xx | xx | xx | xx |
USA ARTIFICIAL INTELLIGENCE MARKET SIZE, BY END-USER INDUSTRY, 2023-2030 (USD BILLION)
By End-User Industry | 2023 | 2024 | 2025 | 2026 | 2027 | 2028 | 2029 | 2030 | CAGR (2023-2030) |
---|---|---|---|---|---|---|---|---|---|
Forecast | |||||||||
Residential | xx | xx | xx | xx | xx | xx | xx | xx | xx |
Commercial | xx | xx | xx | xx | xx | xx | xx | xx | xx |
Government | xx | xx | xx | xx | xx | xx | xx | xx | xx |
CANADA ARTIFICIAL INTELLIGENCE MARKET SIZE, BY PRODUCT, 2023-2030 (USD BILLION)
By Product | 2023 | 2024 | 2025 | 2026 | 2027 | 2028 | 2029 | 2030 | CAGR (2023-2030) |
---|---|---|---|---|---|---|---|---|---|
Forecast | |||||||||
Cable Set-Top Boxes | xx | xx | xx | xx | xx | xx | xx | xx | xx |
Satellite Set-Top Boxes | xx | xx | xx | xx | xx | xx | xx | xx | xx |
IPTV Set-Top Boxes | xx | xx | xx | xx | xx | xx | xx | xx | xx |
Smart Set-Top Boxes | xx | xx | xx | xx | xx | xx | xx | xx | xx |
CANADA ARTIFICIAL INTELLIGENCE MARKET SIZE, BY APPLICATION, 2023-2030 (USD BILLION)
By Application | 2023 | 2024 | 2025 | 2026 | 2027 | 2028 | 2029 | 2030 | CAGR (2023-2030) |
---|---|---|---|---|---|---|---|---|---|
Forecast | |||||||||
Entertainment | xx | xx | xx | xx | xx | xx | xx | xx | xx |
Education | xx | xx | xx | xx | xx | xx | xx | xx | xx |
Gaming | xx | xx | xx | xx | xx | xx | xx | xx | xx |
Surveillance | xx | xx | xx | xx | xx | xx | xx | xx | xx |
CANADA ARTIFICIAL INTELLIGENCE MARKET SIZE, BY END-USER INDUSTRY, 2023-2030 (USD BILLION)
By End-User Industry | 2023 | 2024 | 2025 | 2026 | 2027 | 2028 | 2029 | 2030 | CAGR (2023-2030) |
---|---|---|---|---|---|---|---|---|---|
Forecast | |||||||||
Residential | xx | xx | xx | xx | xx | xx | xx | xx | xx |
Commercial | xx | xx | xx | xx | xx | xx | xx | xx | xx |
Government | xx | xx | xx | xx | xx | xx | xx | xx | xx |
MEXICO ARTIFICIAL INTELLIGENCE MARKET SIZE, BY PRODUCT, 2023-2030 (USD BILLION)
By Product | 2023 | 2024 | 2025 | 2026 | 2027 | 2028 | 2029 | 2030 | CAGR (2023-2030) |
---|---|---|---|---|---|---|---|---|---|
Forecast | |||||||||
Cable Set-Top Boxes | xx | xx | xx | xx | xx | xx | xx | xx | xx |
Satellite Set-Top Boxes | xx | xx | xx | xx | xx | xx | xx | xx | xx |
IPTV Set-Top Boxes | xx | xx | xx | xx | xx | xx | xx | xx | xx |
Smart Set-Top Boxes | xx | xx | xx | xx | xx | xx | xx | xx | xx |
MEXICO ARTIFICIAL INTELLIGENCE MARKET SIZE, BY APPLICATION, 2023-2030 (USD BILLION)
By Application | 2023 | 2024 | 2025 | 2026 | 2027 | 2028 | 2029 | 2030 | CAGR (2023-2030) |
---|---|---|---|---|---|---|---|---|---|
Forecast | |||||||||
Entertainment | xx | xx | xx | xx | xx | xx | xx | xx | xx |
Education | xx | xx | xx | xx | xx | xx | xx | xx | xx |
Gaming | xx | xx | xx | xx | xx | xx | xx | xx | xx |
Surveillance | xx | xx | xx | xx | xx | xx | xx | xx | xx |
MEXICO ARTIFICIAL INTELLIGENCE MARKET SIZE, BY END-USER INDUSTRY, 2023-2030 (USD BILLION)
By End-User Industry | 2023 | 2024 | 2025 | 2026 | 2027 | 2028 | 2029 | 2030 | CAGR (2023-2030) |
---|---|---|---|---|---|---|---|---|---|
Forecast | |||||||||
Residential | xx | xx | xx | xx | xx | xx | xx | xx | xx |
Commercial | xx | xx | xx | xx | xx | xx | xx | xx | xx |
Government | xx | xx | xx | xx | xx | xx | xx | xx | xx |
EUROPE ARTIFICIAL INTELLIGENCE MARKET SIZE, BY PRODUCT, 2023-2030 (USD BILLION)
By Product | 2023 | 2024 | 2025 | 2026 | 2027 | 2028 | 2029 | 2030 | CAGR (2023-2030) |
---|---|---|---|---|---|---|---|---|---|
Forecast | |||||||||
Cable Set-Top Boxes | xx | xx | xx | xx | xx | xx | xx | xx | xx |
Satellite Set-Top Boxes | xx | xx | xx | xx | xx | xx | xx | xx | xx |
IPTV Set-Top Boxes | xx | xx | xx | xx | xx | xx | xx | xx | xx |
Smart Set-Top Boxes | xx | xx | xx | xx | xx | xx | xx | xx | xx |
EUROPE ARTIFICIAL INTELLIGENCE MARKET SIZE, BY APPLICATION, 2023-2030 (USD BILLION)
By Application | 2023 | 2024 | 2025 | 2026 | 2027 | 2028 | 2029 | 2030 | CAGR (2023-2030) |
---|---|---|---|---|---|---|---|---|---|
Forecast | |||||||||
Entertainment | xx | xx | xx | xx | xx | xx | xx | xx | xx |
Education | xx | xx | xx | xx | xx | xx | xx | xx | xx |
Gaming | xx | xx | xx | xx | xx | xx | xx | xx | xx |
Surveillance | xx | xx | xx | xx | xx | xx | xx | xx | xx |
EUROPE ARTIFICIAL INTELLIGENCE MARKET SIZE, BY END-USER INDUSTRY, 2023-2030 (USD BILLION)
By End-User Industry | 2023 | 2024 | 2025 | 2026 | 2027 | 2028 | 2029 | 2030 | CAGR (2023-2030) |
---|---|---|---|---|---|---|---|---|---|
Forecast | |||||||||
Residential | xx | xx | xx | xx | xx | xx | xx | xx | xx |
Commercial | xx | xx | xx | xx | xx | xx | xx | xx | xx |
Government | xx | xx | xx | xx | xx | xx | xx | xx | xx |
GERMANY ARTIFICIAL INTELLIGENCE MARKET SIZE, BY PRODUCT, 2023-2030 (USD BILLION)
By Product | 2023 | 2024 | 2025 | 2026 | 2027 | 2028 | 2029 | 2030 | CAGR (2023-2030) |
---|---|---|---|---|---|---|---|---|---|
Forecast | |||||||||
Cable Set-Top Boxes | xx | xx | xx | xx | xx | xx | xx | xx | xx |
Satellite Set-Top Boxes | xx | xx | xx | xx | xx | xx | xx | xx | xx |
IPTV Set-Top Boxes | xx | xx | xx | xx | xx | xx | xx | xx | xx |
Smart Set-Top Boxes | xx | xx | xx | xx | xx | xx | xx | xx | xx |
GERMANY ARTIFICIAL INTELLIGENCE MARKET SIZE, BY APPLICATION, 2023-2030 (USD BILLION)
By Application | 2023 | 2024 | 2025 | 2026 | 2027 | 2028 | 2029 | 2030 | CAGR (2023-2030) |
---|---|---|---|---|---|---|---|---|---|
Forecast | |||||||||
Entertainment | xx | xx | xx | xx | xx | xx | xx | xx | xx |
Education | xx | xx | xx | xx | xx | xx | xx | xx | xx |
Gaming | xx | xx | xx | xx | xx | xx | xx | xx | xx |
Surveillance | xx | xx | xx | xx | xx | xx | xx | xx | xx |
GERMANY ARTIFICIAL INTELLIGENCE MARKET SIZE, BY END-USER INDUSTRY, 2023-2030 (USD BILLION)
By End-User Industry | 2023 | 2024 | 2025 | 2026 | 2027 | 2028 | 2029 | 2030 | CAGR (2023-2030) |
---|---|---|---|---|---|---|---|---|---|
Forecast | |||||||||
Residential | xx | xx | xx | xx | xx | xx | xx | xx | xx |
Commercial | xx | xx | xx | xx | xx | xx | xx | xx | xx |
Government | xx | xx | xx | xx | xx | xx | xx | xx | xx |
UK ARTIFICIAL INTELLIGENCE MARKET SIZE, BY PRODUCT, 2023-2030 (USD BILLION)
By Product | 2023 | 2024 | 2025 | 2026 | 2027 | 2028 | 2029 | 2030 | CAGR (2023-2030) |
---|---|---|---|---|---|---|---|---|---|
Forecast | |||||||||
Cable Set-Top Boxes | xx | xx | xx | xx | xx | xx | xx | xx | xx |
Satellite Set-Top Boxes | xx | xx | xx | xx | xx | xx | xx | xx | xx |
IPTV Set-Top Boxes | xx | xx | xx | xx | xx | xx | xx | xx | xx |
Smart Set-Top Boxes | xx | xx | xx | xx | xx | xx | xx | xx | xx |
UK ARTIFICIAL INTELLIGENCE MARKET SIZE, BY APPLICATION, 2023-2030 (USD BILLION)
By Application | 2023 | 2024 | 2025 | 2026 | 2027 | 2028 | 2029 | 2030 | CAGR (2023-2030) |
---|---|---|---|---|---|---|---|---|---|
Forecast | |||||||||
Entertainment | xx | xx | xx | xx | xx | xx | xx | xx | xx |
Education | xx | xx | xx | xx | xx | xx | xx | xx | xx |
Gaming | xx | xx | xx | xx | xx | xx | xx | xx | xx |
Surveillance | xx | xx | xx | xx | xx | xx | xx | xx | xx |
UK ARTIFICIAL INTELLIGENCE MARKET SIZE, BY END-USER INDUSTRY, 2023-2030 (USD BILLION)
By End-User Industry | 2023 | 2024 | 2025 | 2026 | 2027 | 2028 | 2029 | 2030 | CAGR (2023-2030) |
---|---|---|---|---|---|---|---|---|---|
Forecast | |||||||||
Residential | xx | xx | xx | xx | xx | xx | xx | xx | xx |
Commercial | xx | xx | xx | xx | xx | xx | xx | xx | xx |
Government | xx | xx | xx | xx | xx | xx | xx | xx | xx |
FRANCE ARTIFICIAL INTELLIGENCE MARKET SIZE, BY PRODUCT, 2023-2030 (USD BILLION)
By Product | 2023 | 2024 | 2025 | 2026 | 2027 | 2028 | 2029 | 2030 | CAGR (2023-2030) |
---|---|---|---|---|---|---|---|---|---|
Forecast | |||||||||
Cable Set-Top Boxes | xx | xx | xx | xx | xx | xx | xx | xx | xx |
Satellite Set-Top Boxes | xx | xx | xx | xx | xx | xx | xx | xx | xx |
IPTV Set-Top Boxes | xx | xx | xx | xx | xx | xx | xx | xx | xx |
Smart Set-Top Boxes | xx | xx | xx | xx | xx | xx | xx | xx | xx |
FRANCE ARTIFICIAL INTELLIGENCE MARKET SIZE, BY APPLICATION, 2023-2030 (USD BILLION)
By Application | 2023 | 2024 | 2025 | 2026 | 2027 | 2028 | 2029 | 2030 | CAGR (2023-2030) |
---|---|---|---|---|---|---|---|---|---|
Forecast | |||||||||
Entertainment | xx | xx | xx | xx | xx | xx | xx | xx | xx |
Education | xx | xx | xx | xx | xx | xx | xx | xx | xx |
Gaming | xx | xx | xx | xx | xx | xx | xx | xx | xx |
Surveillance | xx | xx | xx | xx | xx | xx | xx | xx | xx |
FRANCE ARTIFICIAL INTELLIGENCE MARKET SIZE, BY END-USER INDUSTRY, 2023-2030 (USD BILLION)
By End-User Industry | 2023 | 2024 | 2025 | 2026 | 2027 | 2028 | 2029 | 2030 | CAGR (2023-2030) |
---|---|---|---|---|---|---|---|---|---|
Forecast | |||||||||
Residential | xx | xx | xx | xx | xx | xx | xx | xx | xx |
Commercial | xx | xx | xx | xx | xx | xx | xx | xx | xx |
Government | xx | xx | xx | xx | xx | xx | xx | xx | xx |
ITALY ARTIFICIAL INTELLIGENCE MARKET SIZE, BY PRODUCT, 2023-2030 (USD BILLION)
By Product | 2023 | 2024 | 2025 | 2026 | 2027 | 2028 | 2029 | 2030 | CAGR (2023-2030) |
---|---|---|---|---|---|---|---|---|---|
Forecast | |||||||||
Cable Set-Top Boxes | xx | xx | xx | xx | xx | xx | xx | xx | xx |
Satellite Set-Top Boxes | xx | xx | xx | xx | xx | xx | xx | xx | xx |
IPTV Set-Top Boxes | xx | xx | xx | xx | xx | xx | xx | xx | xx |
Smart Set-Top Boxes | xx | xx | xx | xx | xx | xx | xx | xx | xx |
ITALY ARTIFICIAL INTELLIGENCE MARKET SIZE, BY APPLICATION, 2023-2030 (USD BILLION)
By Application | 2023 | 2024 | 2025 | 2026 | 2027 | 2028 | 2029 | 2030 | CAGR (2023-2030) |
---|---|---|---|---|---|---|---|---|---|
Forecast | |||||||||
Entertainment | xx | xx | xx | xx | xx | xx | xx | xx | xx |
Education | xx | xx | xx | xx | xx | xx | xx | xx | xx |
Gaming | xx | xx | xx | xx | xx | xx | xx | xx | xx |
Surveillance | xx | xx | xx | xx | xx | xx | xx | xx | xx |
ITALY ARTIFICIAL INTELLIGENCE MARKET SIZE, BY END-USER INDUSTRY, 2023-2030 (USD BILLION)
By End-User Industry | 2023 | 2024 | 2025 | 2026 | 2027 | 2028 | 2029 | 2030 | CAGR (2023-2030) |
---|---|---|---|---|---|---|---|---|---|
Forecast | |||||||||
Residential | xx | xx | xx | xx | xx | xx | xx | xx | xx |
Commercial | xx | xx | xx | xx | xx | xx | xx | xx | xx |
Government | xx | xx | xx | xx | xx | xx | xx | xx | xx |
SPAIN ARTIFICIAL INTELLIGENCE MARKET SIZE, BY PRODUCT, 2023-2030 (USD BILLION)
By Product | 2023 | 2024 | 2025 | 2026 | 2027 | 2028 | 2029 | 2030 | CAGR (2023-2030) |
---|---|---|---|---|---|---|---|---|---|
Forecast | |||||||||
Cable Set-Top Boxes | xx | xx | xx | xx | xx | xx | xx | xx | xx |
Satellite Set-Top Boxes | xx | xx | xx | xx | xx | xx | xx | xx | xx |
IPTV Set-Top Boxes | xx | xx | xx | xx | xx | xx | xx | xx | xx |
Smart Set-Top Boxes | xx | xx | xx | xx | xx | xx | xx | xx | xx |
SPAIN ARTIFICIAL INTELLIGENCE MARKET SIZE, BY APPLICATION, 2023-2030 (USD BILLION)
By Application | 2023 | 2024 | 2025 | 2026 | 2027 | 2028 | 2029 | 2030 | CAGR (2023-2030) |
---|---|---|---|---|---|---|---|---|---|
Forecast | |||||||||
Entertainment | xx | xx | xx | xx | xx | xx | xx | xx | xx |
Education | xx | xx | xx | xx | xx | xx | xx | xx | xx |
Gaming | xx | xx | xx | xx | xx | xx | xx | xx | xx |
Surveillance | xx | xx | xx | xx | xx | xx | xx | xx | xx |
SPAIN ARTIFICIAL INTELLIGENCE MARKET SIZE, BY END-USER INDUSTRY, 2023-2030 (USD BILLION)
By End-User Industry | 2023 | 2024 | 2025 | 2026 | 2027 | 2028 | 2029 | 2030 | CAGR (2023-2030) |
---|---|---|---|---|---|---|---|---|---|
Forecast | |||||||||
Residential | xx | xx | xx | xx | xx | xx | xx | xx | xx |
Commercial | xx | xx | xx | xx | xx | xx | xx | xx | xx |
Government | xx | xx | xx | xx | xx | xx | xx | xx | xx |
ASIA-PACIFIC ARTIFICIAL INTELLIGENCE MARKET SIZE, BY PRODUCT, 2023-2030 (USD BILLION)
By Product | 2023 | 2024 | 2025 | 2026 | 2027 | 2028 | 2029 | 2030 | CAGR (2023-2030) |
---|---|---|---|---|---|---|---|---|---|
Forecast | |||||||||
Cable Set-Top Boxes | xx | xx | xx | xx | xx | xx | xx | xx | xx |
Satellite Set-Top Boxes | xx | xx | xx | xx | xx | xx | xx | xx | xx |
IPTV Set-Top Boxes | xx | xx | xx | xx | xx | xx | xx | xx | xx |
Smart Set-Top Boxes | xx | xx | xx | xx | xx | xx | xx | xx | xx |
ASIA-PACIFIC ARTIFICIAL INTELLIGENCE MARKET SIZE, BY APPLICATION, 2023-2030 (USD BILLION)
By Application | 2023 | 2024 | 2025 | 2026 | 2027 | 2028 | 2029 | 2030 | CAGR (2023-2030) |
---|---|---|---|---|---|---|---|---|---|
Forecast | |||||||||
Entertainment | xx | xx | xx | xx | xx | xx | xx | xx | xx |
Education | xx | xx | xx | xx | xx | xx | xx | xx | xx |
Gaming | xx | xx | xx | xx | xx | xx | xx | xx | xx |
Surveillance | xx | xx | xx | xx | xx | xx | xx | xx | xx |
ASIA-PACIFIC ARTIFICIAL INTELLIGENCE MARKET SIZE, BY END-USER INDUSTRY, 2023-2030 (USD BILLION)
By End-User Industry | 2023 | 2024 | 2025 | 2026 | 2027 | 2028 | 2029 | 2030 | CAGR (2023-2030) |
---|---|---|---|---|---|---|---|---|---|
Forecast | |||||||||
Residential | xx | xx | xx | xx | xx | xx | xx | xx | xx |
Commercial | xx | xx | xx | xx | xx | xx | xx | xx | xx |
Government | xx | xx | xx | xx | xx | xx | xx | xx | xx |
CHINA ARTIFICIAL INTELLIGENCE MARKET SIZE, BY PRODUCT, 2023-2030 (USD BILLION)
By Product | 2023 | 2024 | 2025 | 2026 | 2027 | 2028 | 2029 | 2030 | CAGR (2023-2030) |
---|---|---|---|---|---|---|---|---|---|
Forecast | |||||||||
Cable Set-Top Boxes | xx | xx | xx | xx | xx | xx | xx | xx | xx |
Satellite Set-Top Boxes | xx | xx | xx | xx | xx | xx | xx | xx | xx |
IPTV Set-Top Boxes | xx | xx | xx | xx | xx | xx | xx | xx | xx |
Smart Set-Top Boxes | xx | xx | xx | xx | xx | xx | xx | xx | xx |
CHINA ARTIFICIAL INTELLIGENCE MARKET SIZE, BY APPLICATION, 2023-2030 (USD BILLION)
By Application | 2023 | 2024 | 2025 | 2026 | 2027 | 2028 | 2029 | 2030 | CAGR (2023-2030) |
---|---|---|---|---|---|---|---|---|---|
Forecast | |||||||||
Entertainment | xx | xx | xx | xx | xx | xx | xx | xx | xx |
Education | xx | xx | xx | xx | xx | xx | xx | xx | xx |
Gaming | xx | xx | xx | xx | xx | xx | xx | xx | xx |
Surveillance | xx | xx | xx | xx | xx | xx | xx | xx | xx |
CHINA ARTIFICIAL INTELLIGENCE MARKET SIZE, BY END-USER INDUSTRY, 2023-2030 (USD BILLION)
By End-User Industry | 2023 | 2024 | 2025 | 2026 | 2027 | 2028 | 2029 | 2030 | CAGR (2023-2030) |
---|---|---|---|---|---|---|---|---|---|
Forecast | |||||||||
Residential | xx | xx | xx | xx | xx | xx | xx | xx | xx |
Commercial | xx | xx | xx | xx | xx | xx | xx | xx | xx |
Government | xx | xx | xx | xx | xx | xx | xx | xx | xx |
JAPAN ARTIFICIAL INTELLIGENCE MARKET SIZE, BY PRODUCT, 2023-2030 (USD BILLION)
By Product | 2023 | 2024 | 2025 | 2026 | 2027 | 2028 | 2029 | 2030 | CAGR (2023-2030) |
---|---|---|---|---|---|---|---|---|---|
Forecast | |||||||||
Cable Set-Top Boxes | xx | xx | xx | xx | xx | xx | xx | xx | xx |
Satellite Set-Top Boxes | xx | xx | xx | xx | xx | xx | xx | xx | xx |
IPTV Set-Top Boxes | xx | xx | xx | xx | xx | xx | xx | xx | xx |
Smart Set-Top Boxes | xx | xx | xx | xx | xx | xx | xx | xx | xx |
JAPAN ARTIFICIAL INTELLIGENCE MARKET SIZE, BY APPLICATION, 2023-2030 (USD BILLION)
By Application | 2023 | 2024 | 2025 | 2026 | 2027 | 2028 | 2029 | 2030 | CAGR (2023-2030) |
---|---|---|---|---|---|---|---|---|---|
Forecast | |||||||||
Entertainment | xx | xx | xx | xx | xx | xx | xx | xx | xx |
Education | xx | xx | xx | xx | xx | xx | xx | xx | xx |
Gaming | xx | xx | xx | xx | xx | xx | xx | xx | xx |
Surveillance | xx | xx | xx | xx | xx | xx | xx | xx | xx |
JAPAN ARTIFICIAL INTELLIGENCE MARKET SIZE, BY END-USER INDUSTRY, 2023-2030 (USD BILLION)
By End-User Industry | 2023 | 2024 | 2025 | 2026 | 2027 | 2028 | 2029 | 2030 | CAGR (2023-2030) |
---|---|---|---|---|---|---|---|---|---|
Forecast | |||||||||
Residential | xx | xx | xx | xx | xx | xx | xx | xx | xx |
Commercial | xx | xx | xx | xx | xx | xx | xx | xx | xx |
Government | xx | xx | xx | xx | xx | xx | xx | xx | xx |
INDIA ARTIFICIAL INTELLIGENCE MARKET SIZE, BY PRODUCT, 2023-2030 (USD BILLION)
By Product | 2023 | 2024 | 2025 | 2026 | 2027 | 2028 | 2029 | 2030 | CAGR (2023-2030) |
---|---|---|---|---|---|---|---|---|---|
Forecast | |||||||||
Cable Set-Top Boxes | xx | xx | xx | xx | xx | xx | xx | xx | xx |
Satellite Set-Top Boxes | xx | xx | xx | xx | xx | xx | xx | xx | xx |
IPTV Set-Top Boxes | xx | xx | xx | xx | xx | xx | xx | xx | xx |
Smart Set-Top Boxes | xx | xx | xx | xx | xx | xx | xx | xx | xx |
INDIA ARTIFICIAL INTELLIGENCE MARKET SIZE, BY APPLICATION, 2023-2030 (USD BILLION)
By Application | 2023 | 2024 | 2025 | 2026 | 2027 | 2028 | 2029 | 2030 | CAGR (2023-2030) |
---|---|---|---|---|---|---|---|---|---|
Forecast | |||||||||
Entertainment | xx | xx | xx | xx | xx | xx | xx | xx | xx |
Education | xx | xx | xx | xx | xx | xx | xx | xx | xx |
Gaming | xx | xx | xx | xx | xx | xx | xx | xx | xx |
Surveillance | xx | xx | xx | xx | xx | xx | xx | xx | xx |
INDIA ARTIFICIAL INTELLIGENCE MARKET SIZE, BY END-USER INDUSTRY, 2023-2030 (USD BILLION)
By End-User Industry | 2023 | 2024 | 2025 | 2026 | 2027 | 2028 | 2029 | 2030 | CAGR (2023-2030) |
---|---|---|---|---|---|---|---|---|---|
Forecast | |||||||||
Residential | xx | xx | xx | xx | xx | xx | xx | xx | xx |
Commercial | xx | xx | xx | xx | xx | xx | xx | xx | xx |
Government | xx | xx | xx | xx | xx | xx | xx | xx | xx |
SOUTH KOREA ARTIFICIAL INTELLIGENCE MARKET SIZE, BY PRODUCT, 2023-2030 (USD BILLION)
By Product | 2023 | 2024 | 2025 | 2026 | 2027 | 2028 | 2029 | 2030 | CAGR (2023-2030) |
---|---|---|---|---|---|---|---|---|---|
Forecast | |||||||||
Cable Set-Top Boxes | xx | xx | xx | xx | xx | xx | xx | xx | xx |
Satellite Set-Top Boxes | xx | xx | xx | xx | xx | xx | xx | xx | xx |
IPTV Set-Top Boxes | xx | xx | xx | xx | xx | xx | xx | xx | xx |
Smart Set-Top Boxes | xx | xx | xx | xx | xx | xx | xx | xx | xx |
SOUTH KOREA ARTIFICIAL INTELLIGENCE MARKET SIZE, BY APPLICATION, 2023-2030 (USD BILLION)
By Application | 2023 | 2024 | 2025 | 2026 | 2027 | 2028 | 2029 | 2030 | CAGR (2023-2030) |
---|---|---|---|---|---|---|---|---|---|
Forecast | |||||||||
Entertainment | xx | xx | xx | xx | xx | xx | xx | xx | xx |
Education | xx | xx | xx | xx | xx | xx | xx | xx | xx |
Gaming | xx | xx | xx | xx | xx | xx | xx | xx | xx |
Surveillance | xx | xx | xx | xx | xx | xx | xx | xx | xx |
SOUTH KOREA ARTIFICIAL INTELLIGENCE MARKET SIZE, BY END-USER INDUSTRY, 2023-2030 (USD BILLION)
By End-User Industry | 2023 | 2024 | 2025 | 2026 | 2027 | 2028 | 2029 | 2030 | CAGR (2023-2030) |
---|---|---|---|---|---|---|---|---|---|
Forecast | |||||||||
Residential | xx | xx | xx | xx | xx | xx | xx | xx | xx |
Commercial | xx | xx | xx | xx | xx | xx | xx | xx | xx |
Government | xx | xx | xx | xx | xx | xx | xx | xx | xx |
AUSTRALIA ARTIFICIAL INTELLIGENCE MARKET SIZE, BY PRODUCT, 2023-2030 (USD BILLION)
By Product | 2023 | 2024 | 2025 | 2026 | 2027 | 2028 | 2029 | 2030 | CAGR (2023-2030) |
---|---|---|---|---|---|---|---|---|---|
Forecast | |||||||||
Cable Set-Top Boxes | xx | xx | xx | xx | xx | xx | xx | xx | xx |
Satellite Set-Top Boxes | xx | xx | xx | xx | xx | xx | xx | xx | xx |
IPTV Set-Top Boxes | xx | xx | xx | xx | xx | xx | xx | xx | xx |
Smart Set-Top Boxes | xx | xx | xx | xx | xx | xx | xx | xx | xx |
AUSTRALIA ARTIFICIAL INTELLIGENCE MARKET SIZE, BY APPLICATION, 2023-2030 (USD BILLION)
By Application | 2023 | 2024 | 2025 | 2026 | 2027 | 2028 | 2029 | 2030 | CAGR (2023-2030) |
---|---|---|---|---|---|---|---|---|---|
Forecast | |||||||||
Entertainment | xx | xx | xx | xx | xx | xx | xx | xx | xx |
Education | xx | xx | xx | xx | xx | xx | xx | xx | xx |
Gaming | xx | xx | xx | xx | xx | xx | xx | xx | xx |
Surveillance | xx | xx | xx | xx | xx | xx | xx | xx | xx |
AUSTRALIA ARTIFICIAL INTELLIGENCE MARKET SIZE, BY END-USER INDUSTRY, 2023-2030 (USD BILLION)
By End-User Industry | 2023 | 2024 | 2025 | 2026 | 2027 | 2028 | 2029 | 2030 | CAGR (2023-2030) |
---|---|---|---|---|---|---|---|---|---|
Forecast | |||||||||
Residential | xx | xx | xx | xx | xx | xx | xx | xx | xx |
Commercial | xx | xx | xx | xx | xx | xx | xx | xx | xx |
Government | xx | xx | xx | xx | xx | xx | xx | xx | xx |
MIDDLE-EAST & AFRICA ARTIFICIAL INTELLIGENCE MARKET SIZE, BY PRODUCT, 2023-2030 (USD BILLION)
By Product | 2023 | 2024 | 2025 | 2026 | 2027 | 2028 | 2029 | 2030 | CAGR (2023-2030) |
---|---|---|---|---|---|---|---|---|---|
Forecast | |||||||||
Cable Set-Top Boxes | xx | xx | xx | xx | xx | xx | xx | xx | xx |
Satellite Set-Top Boxes | xx | xx | xx | xx | xx | xx | xx | xx | xx |
IPTV Set-Top Boxes | xx | xx | xx | xx | xx | xx | xx | xx | xx |
Smart Set-Top Boxes | xx | xx | xx | xx | xx | xx | xx | xx | xx |
MIDDLE-EAST & AFRICA ARTIFICIAL INTELLIGENCE MARKET SIZE, BY APPLICATION, 2023-2030 (USD BILLION)
By Application | 2023 | 2024 | 2025 | 2026 | 2027 | 2028 | 2029 | 2030 | CAGR (2023-2030) |
---|---|---|---|---|---|---|---|---|---|
Forecast | |||||||||
Entertainment | xx | xx | xx | xx | xx | xx | xx | xx | xx |
Education | xx | xx | xx | xx | xx | xx | xx | xx | xx |
Gaming | xx | xx | xx | xx | xx | xx | xx | xx | xx |
Surveillance | xx | xx | xx | xx | xx | xx | xx | xx | xx |
MIDDLE-EAST & AFRICA ARTIFICIAL INTELLIGENCE MARKET SIZE, BY END-USER INDUSTRY, 2023-2030 (USD BILLION)
By End-User Industry | 2023 | 2024 | 2025 | 2026 | 2027 | 2028 | 2029 | 2030 | CAGR (2023-2030) |
---|---|---|---|---|---|---|---|---|---|
Forecast | |||||||||
Residential | xx | xx | xx | xx | xx | xx | xx | xx | xx |
Commercial | xx | xx | xx | xx | xx | xx | xx | xx | xx |
Government | xx | xx | xx | xx | xx | xx | xx | xx | xx |
UAE ARTIFICIAL INTELLIGENCE MARKET SIZE, BY PRODUCT, 2023-2030 (USD BILLION)
By Product | 2023 | 2024 | 2025 | 2026 | 2027 | 2028 | 2029 | 2030 | CAGR (2023-2030) |
---|---|---|---|---|---|---|---|---|---|
Forecast | |||||||||
Cable Set-Top Boxes | xx | xx | xx | xx | xx | xx | xx | xx | xx |
Satellite Set-Top Boxes | xx | xx | xx | xx | xx | xx | xx | xx | xx |
IPTV Set-Top Boxes | xx | xx | xx | xx | xx | xx | xx | xx | xx |
Smart Set-Top Boxes | xx | xx | xx | xx | xx | xx | xx | xx | xx |
UAE ARTIFICIAL INTELLIGENCE MARKET SIZE, BY APPLICATION, 2023-2030 (USD BILLION)
By Application | 2023 | 2024 | 2025 | 2026 | 2027 | 2028 | 2029 | 2030 | CAGR (2023-2030) |
---|---|---|---|---|---|---|---|---|---|
Forecast | |||||||||
Entertainment | xx | xx | xx | xx | xx | xx | xx | xx | xx |
Education | xx | xx | xx | xx | xx | xx | xx | xx | xx |
Gaming | xx | xx | xx | xx | xx | xx | xx | xx | xx |
Surveillance | xx | xx | xx | xx | xx | xx | xx | xx | xx |
UAE ARTIFICIAL INTELLIGENCE MARKET SIZE, BY END-USER INDUSTRY, 2023-2030 (USD BILLION)
By End-User Industry | 2023 | 2024 | 2025 | 2026 | 2027 | 2028 | 2029 | 2030 | CAGR (2023-2030) |
---|---|---|---|---|---|---|---|---|---|
Forecast | |||||||||
Residential | xx | xx | xx | xx | xx | xx | xx | xx | xx |
Commercial | xx | xx | xx | xx | xx | xx | xx | xx | xx |
Government | xx | xx | xx | xx | xx | xx | xx | xx | xx |
SOUTH AFRICA ARTIFICIAL INTELLIGENCE MARKET SIZE, BY PRODUCT, 2023-2030 (USD BILLION)
By Product | 2023 | 2024 | 2025 | 2026 | 2027 | 2028 | 2029 | 2030 | CAGR (2023-2030) |
---|---|---|---|---|---|---|---|---|---|
Forecast | |||||||||
Cable Set-Top Boxes | xx | xx | xx | xx | xx | xx | xx | xx | xx |
Satellite Set-Top Boxes | xx | xx | xx | xx | xx | xx | xx | xx | xx |
IPTV Set-Top Boxes | xx | xx | xx | xx | xx | xx | xx | xx | xx |
Smart Set-Top Boxes | xx | xx | xx | xx | xx | xx | xx | xx | xx |
SOUTH AFRICA ARTIFICIAL INTELLIGENCE MARKET SIZE, BY APPLICATION, 2023-2030 (USD BILLION)
By Application | 2023 | 2024 | 2025 | 2026 | 2027 | 2028 | 2029 | 2030 | CAGR (2023-2030) |
---|---|---|---|---|---|---|---|---|---|
Forecast | |||||||||
Entertainment | xx | xx | xx | xx | xx | xx | xx | xx | xx |
Education | xx | xx | xx | xx | xx | xx | xx | xx | xx |
Gaming | xx | xx | xx | xx | xx | xx | xx | xx | xx |
Surveillance | xx | xx | xx | xx | xx | xx | xx | xx | xx |
SOUTH AFRICA ARTIFICIAL INTELLIGENCE MARKET SIZE, BY END-USER INDUSTRY, 2023-2030 (USD BILLION)
By End-User Industry | 2023 | 2024 | 2025 | 2026 | 2027 | 2028 | 2029 | 2030 | CAGR (2023-2030) |
---|---|---|---|---|---|---|---|---|---|
Forecast | |||||||||
Residential | xx | xx | xx | xx | xx | xx | xx | xx | xx |
Commercial | xx | xx | xx | xx | xx | xx | xx | xx | xx |
Government | xx | xx | xx | xx | xx | xx | xx | xx | xx |
SAUDI ARABIA ARTIFICIAL INTELLIGENCE MARKET SIZE, BY PRODUCT, 2023-2030 (USD BILLION)
By Product | 2023 | 2024 | 2025 | 2026 | 2027 | 2028 | 2029 | 2030 | CAGR (2023-2030) |
---|---|---|---|---|---|---|---|---|---|
Forecast | |||||||||
Cable Set-Top Boxes | xx | xx | xx | xx | xx | xx | xx | xx | xx |
Satellite Set-Top Boxes | xx | xx | xx | xx | xx | xx | xx | xx | xx |
IPTV Set-Top Boxes | xx | xx | xx | xx | xx | xx | xx | xx | xx |
Smart Set-Top Boxes | xx | xx | xx | xx | xx | xx | xx | xx | xx |
SAUDI ARABIA ARTIFICIAL INTELLIGENCE MARKET SIZE, BY APPLICATION, 2023-2030 (USD BILLION)
By Application | 2023 | 2024 | 2025 | 2026 | 2027 | 2028 | 2029 | 2030 | CAGR (2023-2030) |
---|---|---|---|---|---|---|---|---|---|
Forecast | |||||||||
Entertainment | xx | xx | xx | xx | xx | xx | xx | xx | xx |
Education | xx | xx | xx | xx | xx | xx | xx | xx | xx |
Gaming | xx | xx | xx | xx | xx | xx | xx | xx | xx |
Surveillance | xx | xx | xx | xx | xx | xx | xx | xx | xx |
SAUDI ARABIA ARTIFICIAL INTELLIGENCE MARKET SIZE, BY END-USER INDUSTRY, 2023-2030 (USD BILLION)
By End-User Industry | 2023 | 2024 | 2025 | 2026 | 2027 | 2028 | 2029 | 2030 | CAGR (2023-2030) |
---|---|---|---|---|---|---|---|---|---|
Forecast | |||||||||
Residential | xx | xx | xx | xx | xx | xx | xx | xx | xx |
Commercial | xx | xx | xx | xx | xx | xx | xx | xx | xx |
Government | xx | xx | xx | xx | xx | xx | xx | xx | xx |
LATIN AMERICA ARTIFICIAL INTELLIGENCE MARKET SIZE, BY PRODUCT, 2023-2030 (USD BILLION)
By Product | 2023 | 2024 | 2025 | 2026 | 2027 | 2028 | 2029 | 2030 | CAGR (2023-2030) |
---|---|---|---|---|---|---|---|---|---|
Forecast | |||||||||
Cable Set-Top Boxes | xx | xx | xx | xx | xx | xx | xx | xx | xx |
Satellite Set-Top Boxes | xx | xx | xx | xx | xx | xx | xx | xx | xx |
IPTV Set-Top Boxes | xx | xx | xx | xx | xx | xx | xx | xx | xx |
Smart Set-Top Boxes | xx | xx | xx | xx | xx | xx | xx | xx | xx |
LATIN AMERICA ARTIFICIAL INTELLIGENCE MARKET SIZE, BY APPLICATION, 2023-2030 (USD BILLION)
By Application | 2023 | 2024 | 2025 | 2026 | 2027 | 2028 | 2029 | 2030 | CAGR (2023-2030) |
---|---|---|---|---|---|---|---|---|---|
Forecast | |||||||||
Entertainment | xx | xx | xx | xx | xx | xx | xx | xx | xx |
Education | xx | xx | xx | xx | xx | xx | xx | xx | xx |
Gaming | xx | xx | xx | xx | xx | xx | xx | xx | xx |
Surveillance | xx | xx | xx | xx | xx | xx | xx | xx | xx |
LATIN AMERICA ARTIFICIAL INTELLIGENCE MARKET SIZE, BY END-USER INDUSTRY, 2023-2030 (USD BILLION)
By End-User Industry | 2023 | 2024 | 2025 | 2026 | 2027 | 2028 | 2029 | 2030 | CAGR (2023-2030) |
---|---|---|---|---|---|---|---|---|---|
Forecast | |||||||||
Residential | xx | xx | xx | xx | xx | xx | xx | xx | xx |
Commercial | xx | xx | xx | xx | xx | xx | xx | xx | xx |
Government | xx | xx | xx | xx | xx | xx | xx | xx | xx |
BRAZIL ARTIFICIAL INTELLIGENCE MARKET SIZE, BY PRODUCT, 2023-2030 (USD BILLION)
By Product | 2023 | 2024 | 2025 | 2026 | 2027 | 2028 | 2029 | 2030 | CAGR (2023-2030) |
---|---|---|---|---|---|---|---|---|---|
Forecast | |||||||||
Cable Set-Top Boxes | xx | xx | xx | xx | xx | xx | xx | xx | xx |
Satellite Set-Top Boxes | xx | xx | xx | xx | xx | xx | xx | xx | xx |
IPTV Set-Top Boxes | xx | xx | xx | xx | xx | xx | xx | xx | xx |
Smart Set-Top Boxes | xx | xx | xx | xx | xx | xx | xx | xx | xx |
BRAZIL ARTIFICIAL INTELLIGENCE MARKET SIZE, BY APPLICATION, 2023-2030 (USD BILLION)
By Application | 2023 | 2024 | 2025 | 2026 | 2027 | 2028 | 2029 | 2030 | CAGR (2023-2030) |
---|---|---|---|---|---|---|---|---|---|
Forecast | |||||||||
Entertainment | xx | xx | xx | xx | xx | xx | xx | xx | xx |
Education | xx | xx | xx | xx | xx | xx | xx | xx | xx |
Gaming | xx | xx | xx | xx | xx | xx | xx | xx | xx |
Surveillance | xx | xx | xx | xx | xx | xx | xx | xx | xx |
BRAZIL ARTIFICIAL INTELLIGENCE MARKET SIZE, BY END-USER INDUSTRY, 2023-2030 (USD BILLION)
By End-User Industry | 2023 | 2024 | 2025 | 2026 | 2027 | 2028 | 2029 | 2030 | CAGR (2023-2030) |
---|---|---|---|---|---|---|---|---|---|
Forecast | |||||||||
Residential | xx | xx | xx | xx | xx | xx | xx | xx | xx |
Commercial | xx | xx | xx | xx | xx | xx | xx | xx | xx |
Government | xx | xx | xx | xx | xx | xx | xx | xx | xx |
ARGENTINA ARTIFICIAL INTELLIGENCE MARKET SIZE, BY PRODUCT, 2023-2030 (USD BILLION)
By Product | 2023 | 2024 | 2025 | 2026 | 2027 | 2028 | 2029 | 2030 | CAGR (2023-2030) |
---|---|---|---|---|---|---|---|---|---|
Forecast | |||||||||
Cable Set-Top Boxes | xx | xx | xx | xx | xx | xx | xx | xx | xx |
Satellite Set-Top Boxes | xx | xx | xx | xx | xx | xx | xx | xx | xx |
IPTV Set-Top Boxes | xx | xx | xx | xx | xx | xx | xx | xx | xx |
Smart Set-Top Boxes | xx | xx | xx | xx | xx | xx | xx | xx | xx |
ARGENTINA ARTIFICIAL INTELLIGENCE MARKET SIZE, BY APPLICATION, 2023-2030 (USD BILLION)
By Application | 2023 | 2024 | 2025 | 2026 | 2027 | 2028 | 2029 | 2030 | CAGR (2023-2030) |
---|---|---|---|---|---|---|---|---|---|
Forecast | |||||||||
Entertainment | xx | xx | xx | xx | xx | xx | xx | xx | xx |
Education | xx | xx | xx | xx | xx | xx | xx | xx | xx |
Gaming | xx | xx | xx | xx | xx | xx | xx | xx | xx |
Surveillance | xx | xx | xx | xx | xx | xx | xx | xx | xx |
ARGENTINA ARTIFICIAL INTELLIGENCE MARKET SIZE, BY END-USER INDUSTRY, 2023-2030 (USD BILLION)
By End-User Industry | 2023 | 2024 | 2025 | 2026 | 2027 | 2028 | 2029 | 2030 | CAGR (2023-2030) |
---|---|---|---|---|---|---|---|---|---|
Forecast | |||||||||
Residential | xx | xx | xx | xx | xx | xx | xx | xx | xx |
Commercial | xx | xx | xx | xx | xx | xx | xx | xx | xx |
Government | xx | xx | xx | xx | xx | xx | xx | xx | xx |
CHILE ARTIFICIAL INTELLIGENCE MARKET SIZE, BY PRODUCT, 2023-2030 (USD BILLION)
By Product | 2023 | 2024 | 2025 | 2026 | 2027 | 2028 | 2029 | 2030 | CAGR (2023-2030) |
---|---|---|---|---|---|---|---|---|---|
Forecast | |||||||||
Cable Set-Top Boxes | xx | xx | xx | xx | xx | xx | xx | xx | xx |
Satellite Set-Top Boxes | xx | xx | xx | xx | xx | xx | xx | xx | xx |
IPTV Set-Top Boxes | xx | xx | xx | xx | xx | xx | xx | xx | xx |
Smart Set-Top Boxes | xx | xx | xx | xx | xx | xx | xx | xx | xx |
CHILE ARTIFICIAL INTELLIGENCE MARKET SIZE, BY APPLICATION, 2023-2030 (USD BILLION)
By Application | 2023 | 2024 | 2025 | 2026 | 2027 | 2028 | 2029 | 2030 | CAGR (2023-2030) |
---|---|---|---|---|---|---|---|---|---|
Forecast | |||||||||
Entertainment | xx | xx | xx | xx | xx | xx | xx | xx | xx |
Education | xx | xx | xx | xx | xx | xx | xx | xx | xx |
Gaming | xx | xx | xx | xx | xx | xx | xx | xx | xx |
Surveillance | xx | xx | xx | xx | xx | xx | xx | xx | xx |
CHILE ARTIFICIAL INTELLIGENCE MARKET SIZE, BY END-USER INDUSTRY, 2023-2030 (USD BILLION)
By End-User Industry | 2023 | 2024 | 2025 | 2026 | 2027 | 2028 | 2029 | 2030 | CAGR (2023-2030) |
---|---|---|---|---|---|---|---|---|---|
Forecast | |||||||||
Residential | xx | xx | xx | xx | xx | xx | xx | xx | xx |
Commercial | xx | xx | xx | xx | xx | xx | xx | xx | xx |
Government | xx | xx | xx | xx | xx | xx | xx | xx | xx |
16 Company Profiles
17 Competitive Landscape
Market Share Analysis
The Set Top Box (STB) market is characterized by varied participation from key players, each competing to carve out substantial market share. The leading firms in this sector include established names like Roku, Amazon, and Apple, alongside traditional cable providers who have adapted to streaming services. Roku holds a significant share due to its user-friendly interface and wide range of available channels, while Amazon's Fire TV is gaining traction by offering unique features integrated with Alexa.
In addition to these industry giants, smaller and emerging companies are also making significant inroads. Companies like Xiaomi and TiVo have been innovating to capture niche markets, appealing to budget-conscious consumers or those seeking specialized services. Xiaomi, in particular, has found success in markets like India, leveraging aggressive pricing and local partnerships to accelerate user adoption.
The competitive dynamics of the STB market reveal a constant struggle among companies for consumer engagement and retention. Market share can fluctuate as companies introduce new features or adopt different business models. Subscription-based streaming has surged, leading to some STB manufacturers forming strategic partnerships with content providers to enhance their offerings and provide a more comprehensive service package to consumers.
The landscape is not static, and shifts can occur rapidly, driven by changes in consumer behavior and technology. Enhanced printing and packaging technology, for example, could lead to a resurgence in demand for certain types of boxes or features that make them more attractive. Evaluating market share also requires looking at geographical trends as different regions exhibit varying preferences for STB functionality, influencing which companies perform well in specific markets.
Ultimately, a thorough market share analysis serves as a crucial tool for stakeholders in the STB industry. By understanding the underlying factors that drive competitive positioning, businesses can strategize effectively, adapt to consumer needs, and ensure continual growth in an ever-evolving marketplace.
Competitive Landscape
The competitive landscape of the Set Top Box market involves a diverse array of players from established technology giants to nimble startups. Each company brings its unique offerings to the table, creating an environment rich in innovation and variety. The competition manifests in various forms, such as pricing strategies, product features, distribution channels, and marketing techniques.
Leading manufacturers, such as Apple, are known for their high-quality products and premium pricing strategies, targeting a consumer base that values performance and integration with other devices. Conversely, companies like Roku and Amazon focus on a more budget-oriented strategy, appealing to a wider audience with accessible and flexible options. This price differentiation and innovative marketing approaches contribute to a complex competitive landscape.
Moreover, the STB market is increasingly characterized by integration with smart home technologies. Companies that can seamlessly incorporate STBs with artificial intelligence and home automation systems position themselves favorably in the market. Microsoft, for instance, has ventured into the STB domain, utilizing its cloud computing capabilities to enhance user experience. By leveraging artificial intelligence to offer tailored content suggestions, such firms are reshaping consumer expectations.
The competitive dynamics are also reflected in the increasing emphasis on content partnerships and distribution agreements. Companies are prioritizing exclusive content deals and bundling streaming services with their STB offerings. This strategy not only helps differentiate their products from others but also attracts consumer interest in a crowded market.
Lastly, the competitive landscape is also influenced by regulations and market dynamics in different regions. The STB market faces varying degrees of regulatory hurdles in different countries, which can impact market entry strategies and competitiveness. Companies must navigate these complexities to establish a robust presence, adapt their strategies, and remain competitive in a continually evolving environment.
Mergers and Acquisitions
Mergers and acquisitions (M&A) activities in the Set Top Box market have been notably integral to fostering growth and consolidation among major players. A key strategic maneuver for companies seeking to expand their market share or strengthen their technological capabilities has been through acquiring complementary firms. Such moves allow industry giants to enhance their product lines and broaden customer offerings.
For instance, when a traditional cable provider acquires a streaming technology company, it can pivot its business model to accommodate changing consumer preferences. The recent trend towards consolidation signifies that companies are increasingly aware of the importance of securing diverse capabilities that only M&A can provide. The merger of AT&T and Time Warner is an example where combining resources enabled the creation of a vast media library and robust distribution channels.
Furthermore, acquisitions often target companies with innovative technologies or promising new products. These targeted purchases can accelerate time-to-market for new features and services, allowing acquirers to outpace their competitors. For instance, if a leading STB manufacturer acquires an AI startup, they can quickly integrate machine learning capabilities into their devices, thereby enhancing personalized user experiences and staying ahead of tech trends.
However, the M&A landscape is not without challenges. Regulatory scrutiny can hinder potential deals, especially if they threaten to disrupt competitive balance in the market. Regulatory bodies often analyze mergers to ensure they do not form monopolistic behaviors that may detrimentally affect consumers. Therefore, companies must engage in thorough due diligence to navigate the complexities of M&A successfully.
Ultimately, M&A activity in the Set Top Box market is expected to intensify as companies look to diversify their offerings and strengthen their competitive positioning amidst ongoing technological advancements and rapidly changing consumer demands. As firms continue to pursue growth through strategic acquisitions, the market will likely see a wave of transformations driven by innovation and consolidation.
Market Growth Strategies
Strategic growth initiatives are critical for companies operating in the highly competitive Set Top Box market. To leverage opportunities and address challenges, industry players are employing a range of growth strategies tailored to enhance their competitiveness. One of the primary strategies being implemented is the focus on product differentiation.
By developing unique STB features that address specific consumer needs, companies can set themselves apart from competitors. For example, manufacturers are increasingly emphasizing capabilities like 4K streaming, voice control integration, and smart home compatibility. This innovation not only attracts new customers but also fosters brand loyalty as users value functionality tailored to their viewing habits.
Another important market growth strategy is the expansion into emerging markets. As broadband access continues to rise globally, companies are targeting countries with less saturation and higher demand for STBs. India and various African nations represent lucrative opportunities where businesses can provide affordable and adaptable products that cater to local content preferences and technologies.
Strategic partnerships and alliances represent an additional pathway for growth. Collaborating with content providers, apps, and other technology firms allows STB manufacturers to offer bundled services that enhance customer value. For instance, integrating popular streaming services directly into STBs not only makes the device more appealing but also simplifies the user experience.
Lastly, improving the customer experience emerges as a focal point of market growth strategies. Companies are leveraging customer feedback to improve product design and functionality continuously. Customer service enhancement, user-friendly interfaces, and after-sales support are becoming increasingly vital as consumers seek holistic experiences that extend beyond the initial purchase.
In summary, companies in the Set Top Box market are embracing diverse growth strategies, focusing on product innovation, geographical expansion, strategic partnerships, and customer-centric approaches. Emphasizing these strategies enables players to remain competitive while adapting to the shifting landscape of consumer preferences and technological advancements.
18 Investment Analysis
Investment Opportunities in the Set-Top Box Market
The set-top box (STB) market has evolved significantly in recent years, driven by advancements in technology and changing consumer preferences. As broadcasters and service providers seek to enhance user experience and expand their service offerings, there are numerous investment opportunities emerging within this dynamic landscape. With the growing adoption of over-the-top (OTT) services, streaming platforms, and smart TV integration, the potential for investors to capitalize on this market is increasingly favorable.
One of the primary opportunities lies in the development of innovative set-top box solutions that integrate seamlessly with existing digital ecosystems. Investors can focus on companies that are pioneering hybrid STB devices, which combine traditional broadcasting with internet-based content delivery. This convergence of technologies opens up avenues for creating more versatile and feature-rich products that can attract a broader consumer base.
Furthermore, the growing trend towards personalization in content consumption presents another lucrative opportunity. Set-top boxes equipped with artificial intelligence (AI) and machine learning algorithms can analyze viewer habits and preferences, allowing for tailored content recommendations. Investors can explore companies that are investing in these technologies, as they are likely to experience significant growth in demand as consumers seek curated viewing experiences.
Additionally, as international markets experience an increase in digital infrastructure development, particularly in emerging economies, the demand for affordable STB solutions is projected to rise. Investors should consider opportunities in companies that specialize in manufacturing cost-effective STB units designed for these markets. This strategy not only taps into a growing consumer base but also promotes digital inclusion by providing access to diverse content.
Lastly, partnerships and collaborations between technology providers, telecommunications companies, and content creators can also yield substantial investment returns. By investing in companies that are forming strategic alliances to deliver integrated services, investors can benefit from the shared resources and expertise that enhance their product offerings and market reach.
Return on Investment (RoI) Analysis
In assessing the potential return on investment (RoI) within the set-top box market, it is essential to consider several key factors that significantly impact profitability. Firstly, the rapid growth of the over-the-top (OTT) content industry has created a surge in demand for STB devices that can deliver such content effectively. Companies that successfully cater to this demand not only increase their market share but also enhance their revenue streams, leading to a higher RoI for investors.
Moreover, the integration of advanced features such as 4K resolution, voice control, and compatibility with smart home technologies can differentiate products in a crowded marketplace. Companies investing in research and development (R&D) to innovate these features are likely to enjoy a competitive advantage, thus driving sales and improving profit margins, resulting in a favorable RoI scenario.
Another pivotal factor that influences RoI is the cost structure associated with manufacturing and distributing set-top boxes. Companies that effectively optimize their supply chain and production processes can lower their operational costs, translating into better profitability. Investors should evaluate firms that implement efficient manufacturing techniques or those leveraging economies of scale to maximize output while minimizing expenses.
Consumer loyalty and brand reputation also play a crucial role in determining RoI. Businesses that focus on building strong relationships with their customers, providing excellent after-sales support, and maintaining consistent product quality are more likely to develop a loyal user base. This loyalty translates into repeat purchases and word-of-mouth referrals, further bolstering financial returns.
Lastly, regulatory changes related to content distribution and technology standards can impact RoI significantly. Investors must stay informed about the regulatory environment in different regions and assess how policies might affect market dynamics. Companies that proactively adapt to regulatory changes or benefit from favorable policies may present more attractive RoI prospects, making them worthy of investment consideration.
Key Factors Influencing Investment Decisions
When considering investments in the set-top box market, several key factors must be taken into account that can greatly influence decision-making processes. Firstly, technology advancements remain at the forefront of investor considerations. Innovations such as 5G technology, cloud computing, and enhanced internet connectivity are transforming the landscape, presenting both opportunities and challenges for set-top box manufacturers. Investors should analyze how companies are positioning themselves to leverage these technologies and remain competitive.
Market trends also play a significant role in investment decisions. The shift towards streaming services and on-demand content consumption has necessitated a new approach to set-top box development. Investors should closely monitor consumer behaviors and preferences to identify shifts that might impact the demand for traditional STB devices. Investing in companies that are adapting to these market trends can yield better long-term yields.
Another crucial aspect is the competitive landscape within the set-top box market. The presence of established players alongside emerging startups creates a complex environment that requires careful evaluation. Investors should consider not only the current market positions of these companies but also their capabilities for innovation, customer engagement strategies, and market expansion plans. Assessing competitive strengths will help in identifying investment opportunities with the highest potential.
The global economic climate also influences investment decisions. Economic downturns or fluctuations can limit consumer spending, impacting the overall demand for set-top boxes. Investors must evaluate macroeconomic indicators and forecast trends that could affect disposable income levels and subsequently the market for luxury items like advanced STB devices.
Ultimately, regulatory and compliance factors should not be overlooked. Local laws governing content distribution, digital rights, and privacy concerns can substantially impact operations and profitability within the set-top box industry. Investors need to conduct thorough due diligence to understand how changes in regulations might influence the companies they are considering investing in and to mitigate potential risks associated with regulatory non-compliance.
Investment Outlook and Future Prospects
The investment outlook for the set-top box market is notably positive, characterized by robust growth trajectories driven by evolving technology and consumer expectations. As more households worldwide adopt smart technology, the demand for multifunctional set-top boxes, capable of streaming, gaming, and interacting with other smart devices, is set to escalate. This trend presents a fertile ground for investors looking to capitalize on the convergence of different media consumption experiences.
Furthermore, with the emergence of new market players and startups focused on niche STB solutions, the competitive dynamics are shifting. This influx of innovation introduces unique products that challenge traditional market leaders, thereby providing investors with diverse options. Investing in these new entrants can be highly lucrative, provided that they demonstrate viable business models and a clear path to market penetration.
Additionally, advancements in cloud technology and edge computing are expected to enhance the capabilities of set-top boxes, making them increasingly versatile. As providers integrate advanced features such as real-time analytics and cloud storage, consumer expectations will further influence product development. Investors should remain attentive to companies that are investing strategically in these technologies, as they will likely lead the market in the future.
Global expansion also presents significant opportunities for investment. Many regions, especially in Asia-Pacific and Latin America, are witnessing a rapid increase in broadband penetration and smartphone adoption, correlating to higher demands for STB solutions. Investors should target companies that are strategically positioned to capitalize on these emerging markets, as they offer high-growth potential.
In conclusion, the future prospects of the set-top box market are promising, underscored by a myriad of investment opportunities. By analyzing trends, embracing technological innovations, and understanding consumer behavior, investors can navigate this exciting market landscape effectively and achieve substantial returns on their investments.
19 Strategic Recommendations
Market Entry Strategies for New Players
Entering the set-top box market presents unique challenges and opportunities for new players. Firstly, it is crucial for any newcomer to conduct extensive market research to understand customer needs, preferences, and emerging trends. This will enable companies to carve out a niche that aligns with untapped demand in the market. Identifying gaps such as advanced features, content diversity, and competitive pricing can provide a significant advantage. Furthermore, new entrants should assess the competitive landscape to strategize on potential entry points that may not be heavily saturated.
Another key strategy involves forming strategic alliances with content providers and telecommunication companies. By collaborating with established players, newcomers can gain access to a broader audience and instantly enhance their service offerings. Content agreements with popular streaming services can serve as a key differentiator, adding value to the standalone functionalities of their set-top box. This partnership approach can mitigate risks and accelerate market penetration.
Investing in technological innovation is also critical for new market entrants. Utilizing cutting-edge technology, such as artificial intelligence and machine learning, can enhance user experience by offering personalized content recommendations. A focus on user interface design that is intuitive and user-friendly will help capture the attention of tech-savvy consumers who demand seamless integration in their viewing experiences. These innovations will not only elevate the product offerings but will also position the brand as a modern solution in a fast-evolving digital landscape.
Marketing efforts should prioritize digital platforms that resonate with the target consumer base. Through social media marketing, influencer collaborations, and targeted ads, new entrants can create awareness and generate interest around their products. Developing an engaging storytelling approach to highlight the unique features of the set-top box can significantly improve market visibility. An agile marketing strategy that adapts to ongoing market feedback and trends will be key to successfully penetrating the market.
Ultimately, a comprehensive approach that combines these strategies – in-depth market research, strategic collaborations, technological innovation, and targeted marketing efforts – will lay a strong foundation for new players looking to establish a presence in the competitive set-top box market.
Expansion and Diversification Strategies for Existing Players
For existing players in the set-top box market, expansion and diversification represent crucial avenues for sustained growth and profitability. One effective strategy is to explore geographic expansion opportunities. Companies should evaluate emerging markets where demand for set-top boxes is rising, driven by the proliferation of streaming services and increased internet access. Tailoring products to meet local consumer preferences and regulations can enhance market acceptance, making this an attractive route for expansion.
Furthermore, existing players should consider diversifying their product lines to incorporate additional functionalities beyond traditional TV viewing. Integrating features such as gaming, smart home connectivity, and voice control can turn the set-top box into a central entertainment hub within a household. This diversification not only attracts a broader customer base but also encourages brand loyalty as consumers find more value in the multifunctionality of a single device.
Leveraging data analytics to understand consumer viewing habits can also provide significant insights that inform expansion efforts. By analyzing usage patterns and preferences, companies can develop targeted marketing campaigns and customized product offerings that resonate with specific audience segments. This data-centric approach not only enhances user experience but also fosters deeper customer engagement and retention.
Companies should also consider vertical integration as a strategy for expansion. By controlling more levels of the supply chain—from content acquisition to hardware manufacturing—players can optimize operational efficiencies and reduce reliance on third parties. This could include exclusive partnerships with content creators or developing proprietary content that is available only through their set-top boxes, creating a unique proposition in the marketplace.
In summary, a combination of geographic exploration, product diversification, consumer data analysis, and vertical integration will empower existing players to expand their market presence while fortifying their business model in the dynamic set-top box industry.
Product Development and Innovation Strategies
To remain competitive in the set-top box market, a dedicated focus on product development and innovation is essential. One fundamental strategy is to invest in research and development (R&D) to pioneer new technologies that improve user experiences. Innovations such as 4K HDR streaming, faster processing capabilities, and enhanced Wi-Fi connectivity can distinguish products in a crowded market. Staying ahead of technological trends ensures that products meet and exceed current consumer expectations.
Additionally, companies should adopt an agile product development approach that embraces feedback from user testing and market trials. By iteratively developing their products based on consumer input, companies can refine functionalities and features to better align with user needs. Engaging early adopters as beta testers can also create a community around the product, fostering brand loyalty and generating word-of-mouth publicity.
Exploring additional integrations with smart home ecosystems represents another vital area for innovation. As the smart home market continues to grow, set-top box manufacturers can create products that seamlessly interact with other devices, such as smart speakers and security systems. This interconnectedness will not only provide convenience for consumers but also position the product as essential within the growing smart home landscape.
A commitment to sustainable practices can also drive innovation in product development. Introducing eco-friendly materials in the manufacturing process, as well as energy-efficient designs, can attract environmentally conscious consumers. Demonstrating a commitment to sustainability not only meets a market demand but also enhances brand reputation and corporate responsibility narratives.
In conclusion, by emphasizing R&D investment, agile development processes, smart home integrations, and sustainability, companies can drive impactful product development and innovation strategies that resonate with today's consumers in the set-top box market.
Collaborative Strategies and Partnerships
Collaboration is becoming a pivotal strategy for success in the highly competitive set-top box market. Building strong partnerships with content providers is essential for enhancing the value proposition offered to consumers. Securing exclusive content agreements can serve as a competitive differentiator, attracting subscribers who seek unique viewing experiences. Additionally, partnerships with popular streaming services will create bundled offerings that appeal to consumer preferences for convenience and diversity in entertainment options.
Another potential collaboration avenue is with technology companies specializing in AI and machine learning. By integrating these technologies into set-top box functionalities, companies can offer personalized content recommendations, automatic recording features, and enhanced search capabilities that enrich user experiences. Collaborating with innovators in the tech space fosters an environment of continuous improvements in product capabilities, ensuring that the offerings remain relevant and competitive.
Engaging with telecommunications companies can also benefit set-top box manufacturers. Many consumers are looking for bundled packages that incorporate broadband and television services. Forming alliances with telcos can lead to mutually beneficial offers, where customers have access to integrated services that combine high-speed internet with advanced set-top box functionalities, enhancing overall value.
Furthermore, leveraging social media influencers and content creators for collaborative marketing campaigns can increase brand visibility and appeal to younger demographics. By working with individuals who resonate with target audiences, companies can effectively promote their set-top boxes in a more authentic and relatable manner. Such collaborations can create buzz around product launches and keep the brand relevant in fast-changing consumer landscapes.
In closing, these collaborative strategies, including partnerships with content providers, technology innovators, telecommunications firms, and influencers, can create substantial synergies for companies in the set-top box market, driving innovation while optimizing market reach and customer engagement.
Marketing and Branding Strategies
An effective marketing and branding strategy is fundamental to capturing consumer attention in the crowded set-top box market. The first step is to define a clear and unique brand identity that resonates with the target audience. A strong brand presence, complemented by a compelling value proposition, will help differentiate products from competitors. Emphasizing innovative features, quality content, and exceptional customer service in branding efforts will aid in building a positive brand image.
Digital marketing channels offer vast opportunities to engage consumers effectively. Companies should utilize social media platforms and targeted online advertising to reach specific demographics. Creating engaging content that highlights product features, customer testimonials, and exclusive offers can drive interest and conversions. Additionally, optimizing the company website for search engines will enhance visibility, making it easier for prospective customers to find product information and promotions.
Empowering customer reviews and testimonials can significantly boost credibility and serve as a valuable marketing tool. Encouraging satisfied customers to share their experiences online will resonate with potential buyers, positioning the product as a trustworthy option. Engaging with feedback, both positive and negative, demonstrates a commitment to quality and customer care, fostering loyalty and encouraging repeat purchases.
Hosting marketing events, such as product launch parties or webinars, can create direct interaction with potential customers. Demonstrating product functionalities through live demonstrations or tutorials will allow consumers to experience the brand firsthand, fostering a deeper connection. Additionally, engaging with influencers to promote these events can amplify outreach and generate excitement around product offerings.
In summary, a comprehensive approach involving brand identity development, digital marketing initiatives, leveraging customer feedback, and hosting promotional events will create a robust marketing and branding strategy for set-top box manufacturers, ensuring long-term market success.
Customer Retention and Relationship Management Strategies
Maintaining customer loyalty is crucial for long-term success in the set-top box market, making retention and relationship management strategies paramount. Understanding and analyzing customer behavior through data analytics allows companies to tailor their offerings and improve overall satisfaction. Regularly assessing customer preferences and viewing habits can inform service enhancements and product updates that align with user expectations.
Implementing a reward and loyalty program can significantly contribute to retaining customers. By offering incentives, such as discounts, exclusive content access, or early releases of new features, companies can encourage ongoing engagement. Loyalty programs not only enhance customer satisfaction but also foster deeper emotional connections with the brand, driving repeat business.
Proactive communication is another effective strategy for relationship management. Keeping customers informed about product updates, new features, and content additions can heighten user engagement and create a sense of community. Utilizing various communication channels, including emails, newsletters, and social media, enables companies to foster lasting relationships that encourage customer interaction and retention.
Providing exceptional customer service is foundational to retaining customers. A dedicated support team that is responsive to inquiries and troubleshooting needs can significantly impact overall customer experience. Offering multiple support channels, such as live chat and phone assistance, ensures that customers feel valued and supported, thereby strengthening their loyalty to the brand.
Lastly, gathering customer feedback through surveys and in-app reviews allows companies to remain aligned with customer needs. Actively seeking out and responding to customer input demonstrates a commitment to continuous improvement and customer satisfaction. By implementing changes based on feedback, companies can enhance their offerings, ensuring that customers feel heard and appreciated in their relationship with the brand.
Set Top Box Market Report Market FAQs
1. What is the market size of the Set Top Box?
The global Set Top Box market size was valued at approximately $17.8 billion in 2020 and is expected to reach $25.3 billion by 2026, growing at a CAGR of around 5.7% during the forecast period.
2. What are the key market players or companies in the Set Top Box industry?
Some of the key market players in the Set Top Box industry include Huawei Technologies Co. Ltd., Samsung Electronics Co. Ltd., Skyworth Digital Holdings Ltd., Technicolor SA, and EchoStar Corporation among others.
3. What are the primary factors driving the growth in the Set Top Box industry?
The primary factors driving the growth in the Set Top Box industry include the increasing demand for enhanced viewing experience, the rise in adoption of OTT streaming services, the development of advanced technologies such as 4K and 8K resolution, and the growing trend of smart and connected homes.
4. Which region is identified as the fastest-growing in the Set Top Box industry?
Asia Pacific is identified as the fastest-growing region in the Set Top Box industry, primarily driven by the increasing disposable income, growing population, rapid urbanization, and the rising demand for digital entertainment in countries like China and India.
5. Does ConsaInsights provide customized market report data for the Set Top Box industry?
Yes, ConsaInsights offers customized market report data for the Set Top Box industry based on specific client requirements and needs. This includes tailored research, analysis, and insights to suit the unique demands of each client.
6. What deliverables can I expect from this Set Top Box market research report?
From this Set Top Box market research report, you can expect comprehensive insights on market trends, market size and forecast, competitive analysis, key market players, growth drivers and challenges, regional analysis, and strategic recommendations for industry stakeholders.