
Smart Food Logistics Market Report
Published Date: 31 January 2026 | Report Code: smart-food-logistics
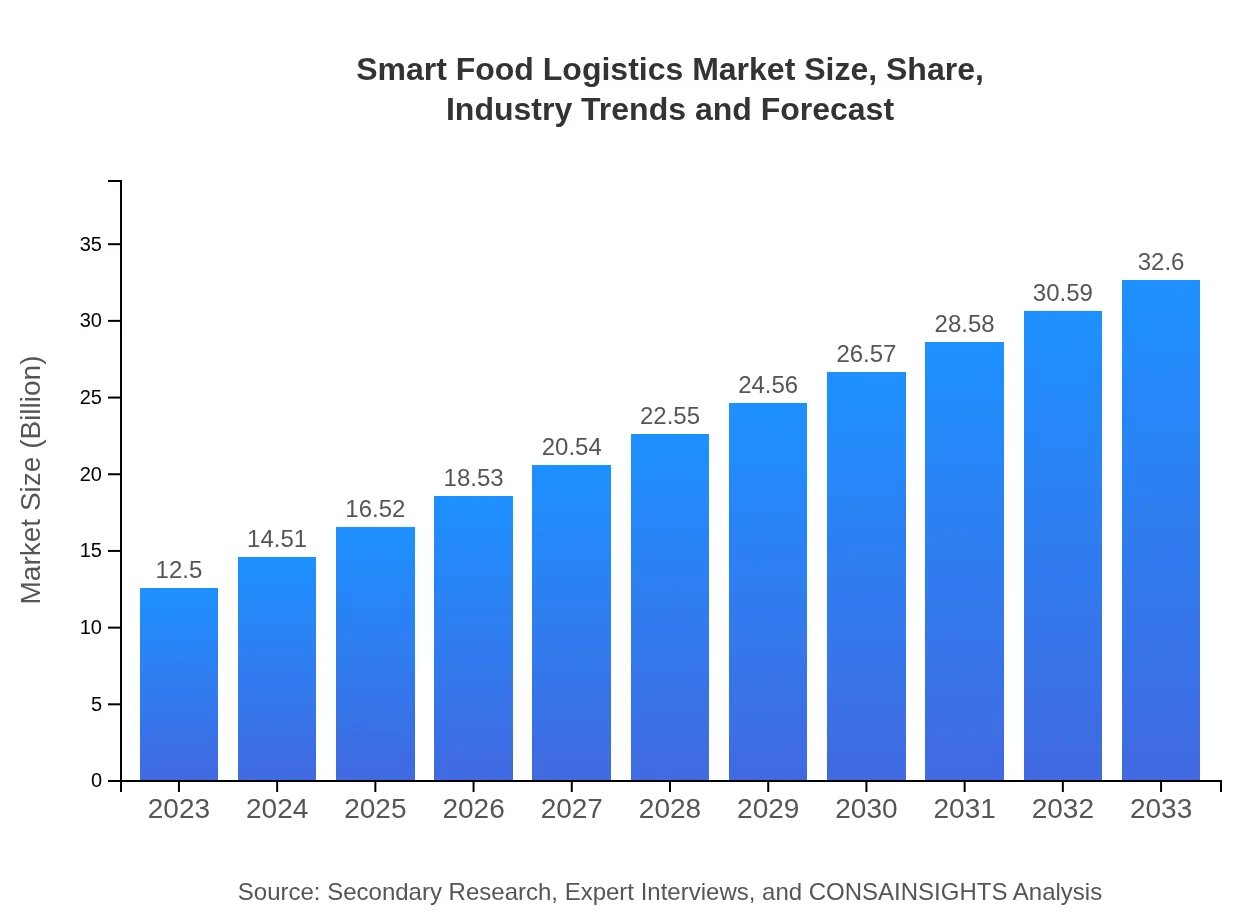
Smart Food Logistics Market Size, Share, Industry Trends and Forecast to 2033
This report provides an in-depth analysis of the Smart Food Logistics market, including trends, forecasts, and insights from 2023 to 2033. It covers various aspects like market size, regional analysis, segmentation, and key players, offering valuable data for stakeholders to make informed decisions.
| Metric | Value |
|---|---|
| Study Period | 2023 - 2033 |
| 2023 Market Size | $12.50 Billion |
| CAGR (2023-2033) | 9.7% |
| 2033 Market Size | $32.60 Billion |
| Top Companies | DHL Supply Chain, XPO Logistics, C.H. Robinson, Lineage Logistics |
| Last Modified Date | 31 January 2026 |
Smart Food Logistics Market Overview
Customize Smart Food Logistics Market Report market research report
- ✔ Get in-depth analysis of Smart Food Logistics market size, growth, and forecasts.
- ✔ Understand Smart Food Logistics's regional dynamics and industry-specific trends.
- ✔ Identify potential applications, end-user demand, and growth segments in Smart Food Logistics
What is the Market Size & CAGR of Smart Food Logistics market in 2023?
Smart Food Logistics Industry Analysis
Smart Food Logistics Market Segmentation and Scope
Tell us your focus area and get a customized research report.
Smart Food Logistics Market Analysis Report by Region
Europe Smart Food Logistics Market Report:
Europe's Smart Food Logistics market is expected to show significant growth, rising from $3.81 billion in 2023 to $9.94 billion by 2033. European countries are prioritizing sustainability and efficiency, with advanced cold chain logistics systems and an emphasis on reducing food waste featuring prominently in market dynamics.Asia Pacific Smart Food Logistics Market Report:
In the Asia Pacific region, the Smart Food Logistics market is expected to grow from $2.51 billion in 2023 to $6.54 billion by 2033, driven by the region's rising population and urbanization. Countries like China and India are investing heavily in smart logistics technologies to enhance supply chain efficiency, addressing challenges such as food waste and distribution.North America Smart Food Logistics Market Report:
North America exhibits a robust Smart Food Logistics market, anticipated to increase from $4.21 billion in 2023 to $10.97 billion by 2033. Advanced technologies like IoT and AI are widely implemented in the region, ensuring stringent compliance with food safety regulations and enhancing freshness and traceability.South America Smart Food Logistics Market Report:
The South American market is projected to grow from $0.86 billion in 2023 to $2.24 billion by 2033. The region is increasingly focused on upgrading its logistics infrastructure to meet growing demand from the retail and food service industries, with Brazil leading the charge in adopting smart food logistics technologies.Middle East & Africa Smart Food Logistics Market Report:
The Middle East and Africa market for Smart Food Logistics will rise from $1.11 billion in 2023 to $2.90 billion by 2033. The region's expanding food retail sector and increasing demand for fresh products are driving investments in smart logistics infrastructure, particularly in urban areas.Tell us your focus area and get a customized research report.
Smart Food Logistics Market Analysis By Transportation Services
Global Smart Food Logistics Market, By Transportation Services Analysis (2023 - 2033)
Transportation services form a significant segment within the Smart Food Logistics market. This segment is expected to grow from $6.94 billion in 2023 to $18.10 billion by 2033. Transportation comprises a critical aspect of logistics, ensuring timely delivery while maintaining product integrity.
Smart Food Logistics Market Analysis By Warehousing Services
Global Smart Food Logistics Market, By Warehousing Services Analysis (2023 - 2033)
The warehousing services sector is projected to expand from $2.71 billion in 2023 to $7.07 billion in 2033. Innovations in temperature-controlled warehousing are crucial to preserving food quality, catering particularly to cold chain and perishable product demands.
Smart Food Logistics Market Analysis By Packaging Solutions
Global Smart Food Logistics Market, By Packaging Solutions Analysis (2023 - 2033)
The market for smart packaging solutions is set to grow from $1.55 billion in 2023 to $4.05 billion by 2033. Advanced packaging technologies are critical for ensuring product safety, prolonging shelf life, and minimizing waste.
Smart Food Logistics Market Analysis By Iot Solutions
Global Smart Food Logistics Market, By IoT Solutions Analysis (2023 - 2033)
IoT solutions lead the smart technology segment, expected to grow from $8.15 billion in 2023 to $21.26 billion by 2033. Through the use of sensors and connectivity, IoT enables real-time monitoring and control of logistics operations, enhancing efficiency and reducing losses.
Smart Food Logistics Market Analysis By Ai Analytics Solutions
Global Smart Food Logistics Market, By AI & Analytics Solutions Analysis (2023 - 2033)
AI and analytics solutions will experience growth from $1.28 billion in 2023 to $3.33 billion by 2033. These technologies facilitate predictive analytics for inventory management and demand forecasting, driving efficiencies across the supply chain.
Smart Food Logistics Market Trends and Future Forecast
Tell us your focus area and get a customized research report.
Global Market Leaders and Top Companies in Smart Food Logistics Industry
DHL Supply Chain:
A leader in the logistics sector, DHL offers integrated logistics solutions with a focus on smart technology and sustainability initiatives, meeting the diverse needs of food distributors and manufacturers.XPO Logistics:
Recognized for its innovative technology applications, XPO Logistics provides comprehensive supply chain solutions that optimize food delivery processes through advanced analytics and IoT solutions.C.H. Robinson:
C.H. Robinson is renowned for its freight brokerage services, employing smart logistics technologies to ensure efficient transportation and cold chain management across multiple regions.Lineage Logistics:
As a prominent cold storage and logistics company, Lineage specializes in temperature-controlled warehousing and distribution, leveraging state-of-the-art technologies to support food logistics.We're grateful to work with incredible clients.


FAQs
What is the market size of smart Food Logistics?
The smart food logistics market is valued at approximately $12.5 billion in 2023 and is projected to grow at a CAGR of 9.7%, reaching significant expansion by 2033.
What are the key market players or companies in this smart Food Logistics industry?
Key players in the smart food logistics industry include major transportation and logistics firms, tech companies specializing in IoT and AI solutions, along with food producers and suppliers who leverage technology for managing logistics.
What are the primary factors driving the growth in the smart food logistics industry?
Growth drivers for the smart food logistics sector include rising consumer demand for fresh food, increasing adoption of automation and IoT technologies, supply chain efficiency, and the focus on sustainable logistics practices.
Which region is the fastest Growing in the smart food logistics market?
North America is the fastest-growing region in the smart food logistics market, expanding from $4.21 billion in 2023 to an estimated $10.97 billion by 2033, reflecting a strong CAGR.
Does ConsaInsights provide customized market report data for the smart food logistics industry?
Yes, ConsaInsights offers customized market report data tailored to specific needs within the smart food logistics industry, helping businesses gain insights relevant to their market strategy.
What deliverables can I expect from this smart food logistics market research project?
You can expect comprehensive reports, market analysis, segment breakdowns, and visualization data charts covering trends, forecasts, and detailed insights into the smart food logistics market.
What are the market trends of smart food logistics?
Current trends in the smart food logistics market include increased IoT integration, the rise of blockchain for transparency, automation in logistics, improvements in cold chain management, and a focus on sustainability.