
Smart Process Application Spa Market Report
Published Date: 31 January 2026 | Report Code: smart-process-application-spa
Smart Process Application Spa Market Size, Share, Industry Trends and Forecast to 2033
This report provides a comprehensive analysis of the Smart Process Application Spa market, covering market size, segmentations, regional insights, technology trends, and future forecasts for the decade spanning 2023 to 2033.
| Metric | Value |
|---|---|
| Study Period | 2023 - 2033 |
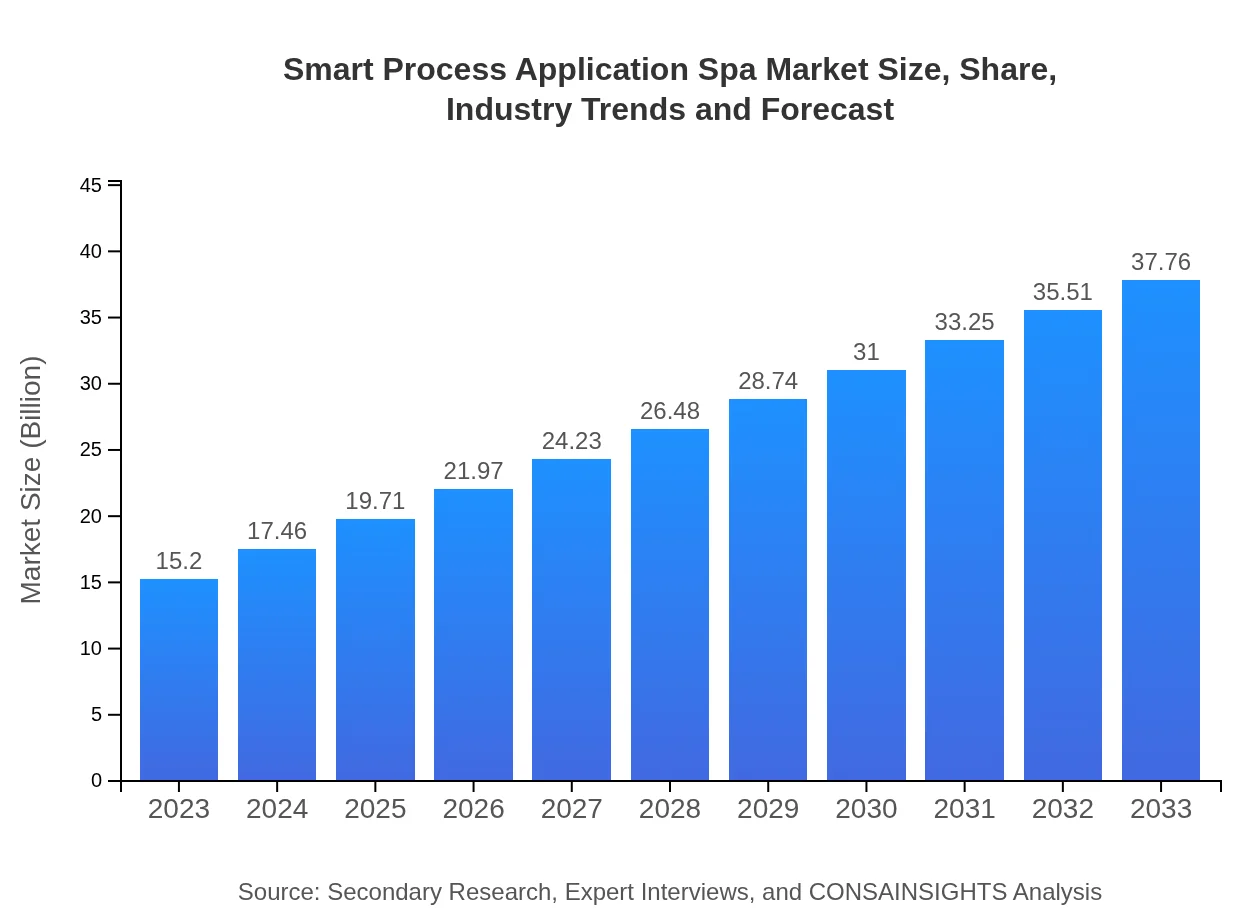
| 2023 Market Size | $15.20 Billion |
| CAGR (2023-2033) | 9.2% |
| 2033 Market Size | $37.76 Billion |
| Top Companies | IBM Corporation, SAP SE, Oracle Corporation, Microsoft Corporation |
| Last Modified Date | 31 January 2026 |
Smart Process Application Spa Market Overview
Customize Smart Process Application Spa Market Report market research report
- ✔ Get in-depth analysis of Smart Process Application Spa market size, growth, and forecasts.
- ✔ Understand Smart Process Application Spa's regional dynamics and industry-specific trends.
- ✔ Identify potential applications, end-user demand, and growth segments in Smart Process Application Spa
What is the Market Size & CAGR of Smart Process Application Spa market in 2023?
Smart Process Application Spa Industry Analysis
Smart Process Application Spa Market Segmentation and Scope
Tell us your focus area and get a customized research report.
Smart Process Application Spa Market Analysis Report by Region
Europe Smart Process Application Spa Market Report:
Europe is expected to witness robust growth, with market size projected to grow from $3.94 billion in 2023 to $9.79 billion by 2033. Regulatory compliance and the need for agile business operations are major drivers of SPA adoption. Countries such as Germany, France, and the UK are at the forefront of this growth.Asia Pacific Smart Process Application Spa Market Report:
In the Asia Pacific region, the market is expected to grow from $3.15 billion in 2023 to $7.82 billion by 2033, driven by rapid digital transformation in economies like China, India, and Japan. The demand for SPAs in manufacturing and healthcare is particularly strong, as organizations look to streamline their operations and comply with new regulations.North America Smart Process Application Spa Market Report:
The North American region holds a significant market share, anticipated to expand from $5.83 billion in 2023 to $14.48 billion by 2033. High investments in cloud and AI technologies, along with a strong focus on innovation and operational efficiency among enterprises, drive the substantial growth seen in this region.South America Smart Process Application Spa Market Report:
The South American market is projected to escalate from $1.43 billion in 2023 to $3.57 billion by 2033. Although the market is currently smaller compared to other regions, the growth is fueled by increasing adoption of technology in the banking and healthcare sectors. Initiatives aimed at improving business processes are gaining momentum.Middle East & Africa Smart Process Application Spa Market Report:
The market in the Middle East and Africa is forecasted to rise from $0.85 billion in 2023 to $2.11 billion by 2033. Increasing investment in technology infrastructure and a drive towards automation in various sectors are propelling the expansion of SPAs in this region.Tell us your focus area and get a customized research report.
Smart Process Application Spa Market Analysis By Product
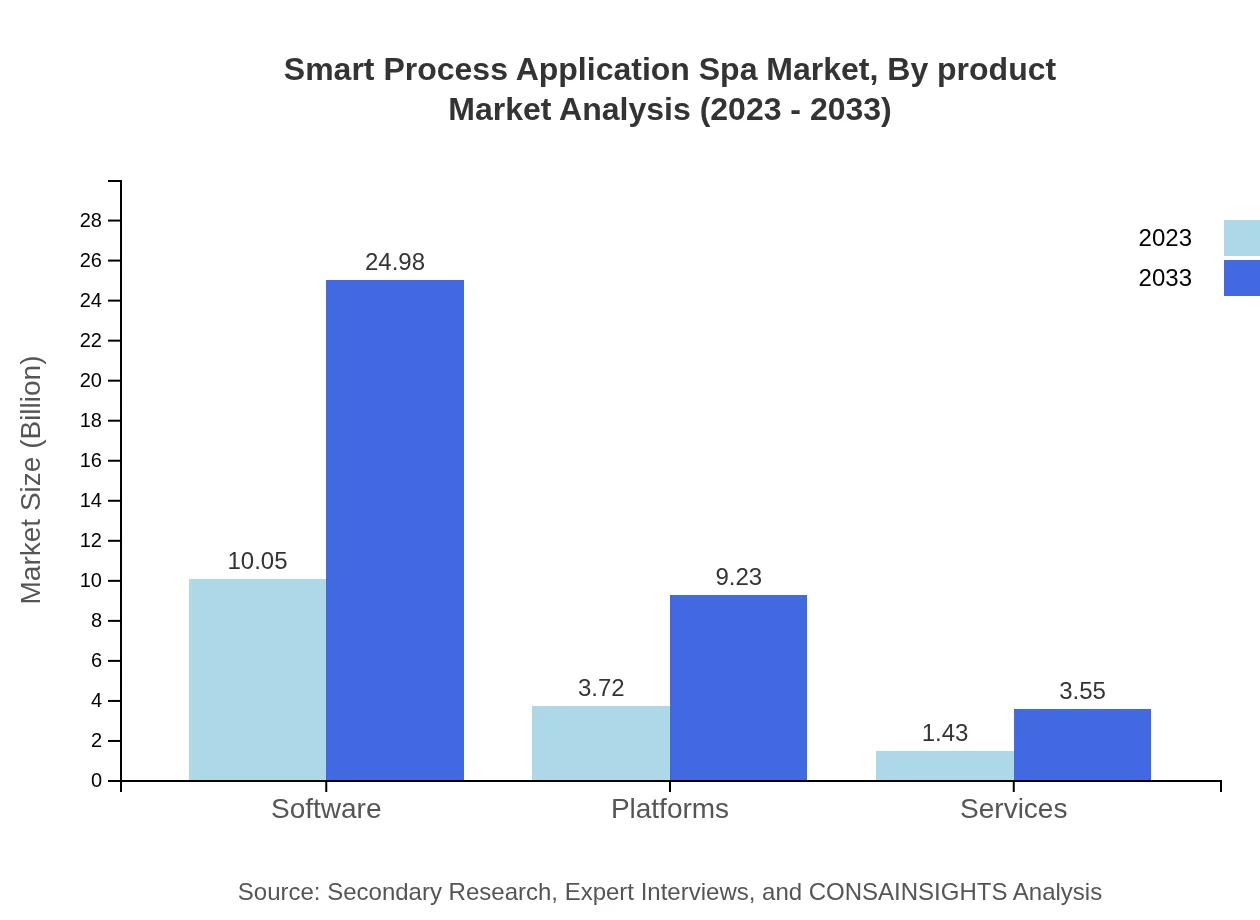
The Smart Process Application market by product segment includes Software, Platforms, and Services. In 2023, Software represents the largest share with a market size of $10.05 billion and is expected to grow to $24.98 billion by 2033. Platforms followed with a market size of $3.72 billion in 2023, growing to $9.23 billion. Services, while smaller, also demonstrate growth from $1.43 billion to $3.55 billion over the same period.
Smart Process Application Spa Market Analysis By Application

Applications of Smart Process Applications span across various sectors. The largest segment is Banking & Financial Services, with a market size of $8.29 billion in 2023, projected to reach $20.59 billion in 2033. Healthcare follows closely, growing from $3.70 billion to $9.20 billion. Manufacturing and Telecommunications are also significant segments in the market, supporting both operational efficiency and customer service improvements.
Smart Process Application Spa Market Analysis By End User
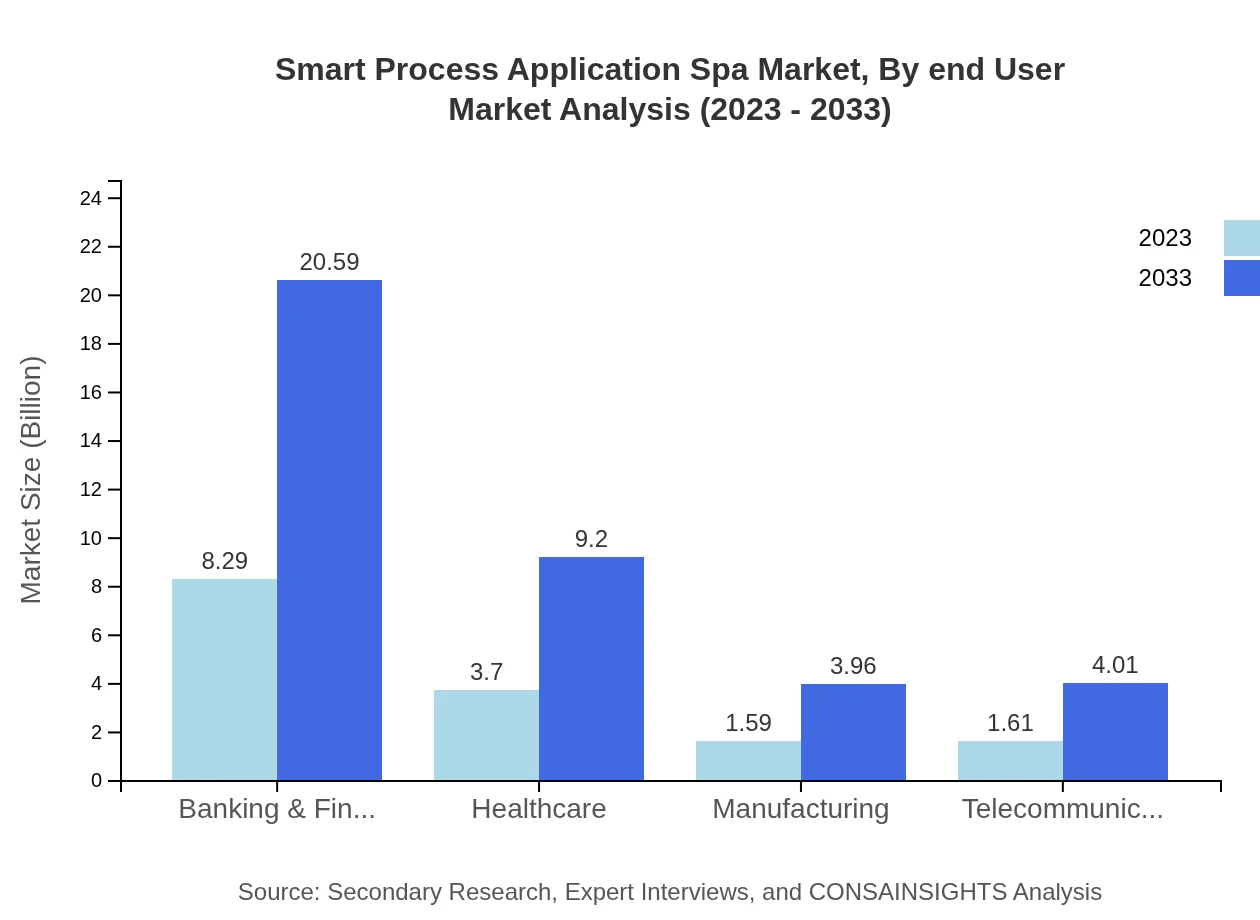
The end-user industry segment indicates strong reliance on Smart Process Applications in Banking & Financial Services, Healthcare, Manufacturing, and Telecommunications. The Banking & Financial Services sector dominates with a 54.53% share in 2023, reflecting the importance of SPAs in compliance and process efficiency. Other industries are witnessing increasing adoption rates as digitization efforts expand.
Smart Process Application Spa Market Analysis By Deployment Model
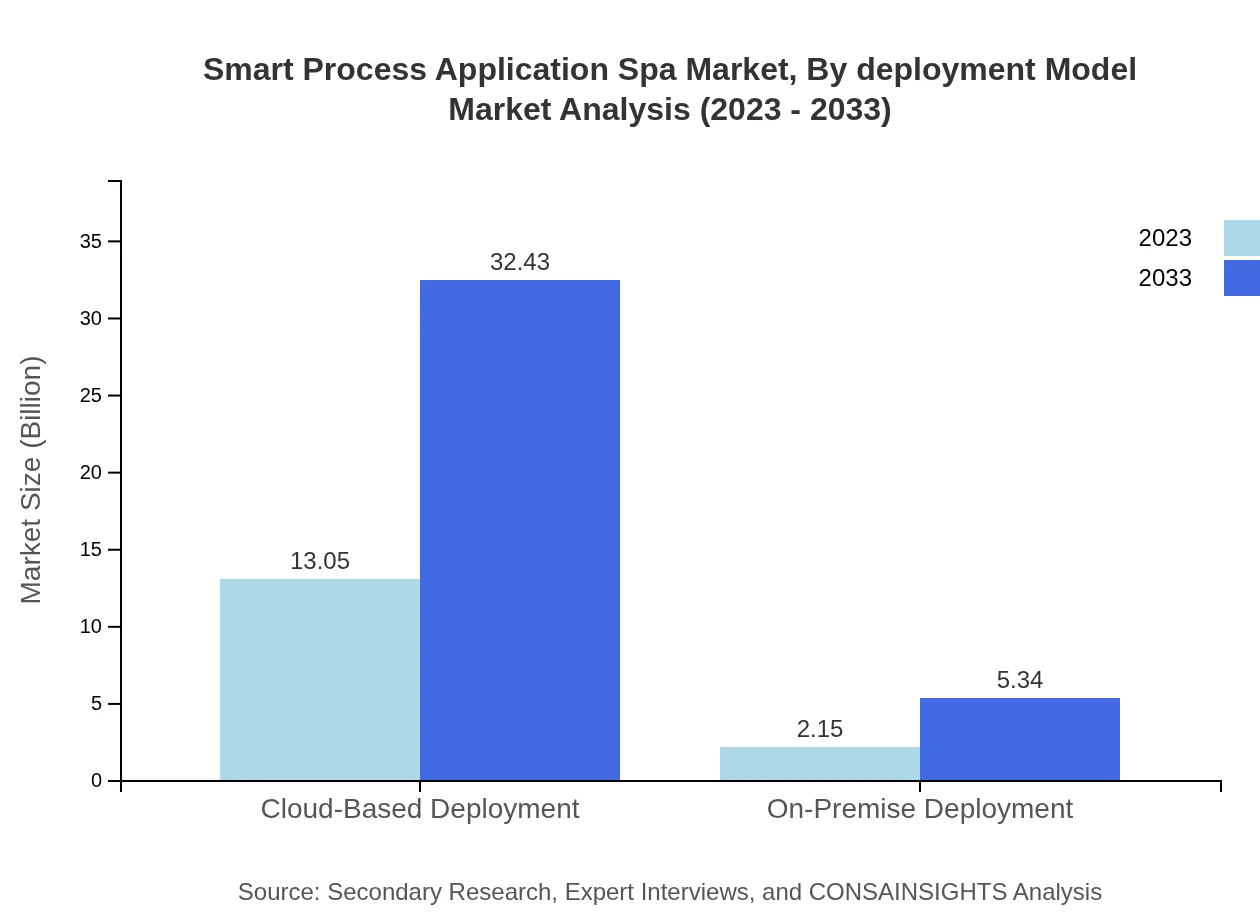
The market segment by deployment model reveals a clear preference for Cloud-Based solutions, which accounted for an impressive 85.87% market share in 2023. Analysts project growth from $13.05 billion in 2023 to $32.43 billion by 2033. On-Premise solutions are currently smaller but still hold a crucial 14.13% share.
Smart Process Application Spa Market Analysis By Technology
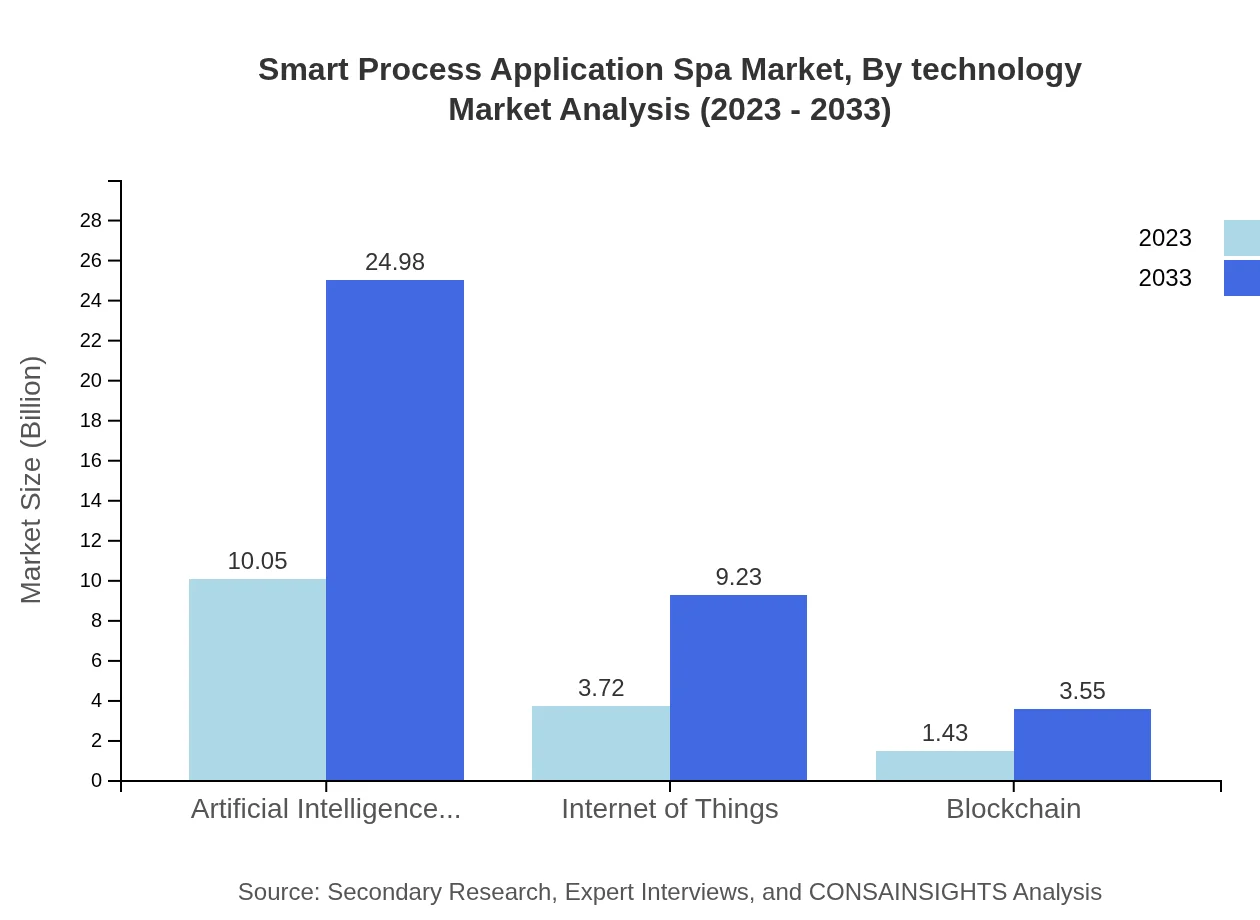
Technologies such as AI, IoT, and Blockchain are central to Smart Process Applications. AI and Machine Learning lead the way in size and market share, expected to grow from $10.05 billion in 2023 to $24.98 billion by 2033, maintaining a 66.15% share. The IoT segment and Blockchain also demonstrate remarkable growth rates, forecasted at $3.72 billion and $1.43 billion, respectively, by 2023.
Smart Process Application Spa Market Trends and Future Forecast
Tell us your focus area and get a customized research report.
Global Market Leaders and Top Companies in Smart Process Application Spa Industry
IBM Corporation:
IBM is a leading technology company providing a multitude of solutions across Smart Process Applications, leveraging its advanced AI capabilities to enhance decision-making and operational agility.SAP SE:
SAP offers a robust portfolio in business software, particularly excelling in smart process automation solutions that facilitate integrated business operations across industries.Oracle Corporation:
Oracle specializes in cloud and software solutions that enhance enterprise resource planning, utilizing smart process applications to optimize performance and drive compliance.Microsoft Corporation:
Microsoft provides favorable SPA solutions integrating AI, machine learning, and cloud technologies to create comprehensive automation for businesses around the globe.We're grateful to work with incredible clients.


FAQs
What is the market size of smart Process Application Spa?
The smart process application (SPA) market is valued at approximately $15.2 billion in 2023, with a projected compound annual growth rate (CAGR) of 9.2% through 2033, indicating robust growth in demand and application.
What are the key market players or companies in this smart Process Application Spa industry?
Key players in the smart process application industry include prominent technology firms specializing in software and automation tools. Major companies often focus on innovative solutions to enhance operational efficiency and address evolving market needs.
What are the primary factors driving the growth in the smart Process Application Spa industry?
Growth in the smart process application industry is primarily driven by the increasing demand for automation, the rise of artificial intelligence, cloud computing adoption, and the need for businesses to improve efficiency and customer experience, all contributing to a competitive market.
Which region is the fastest Growing in the smart Process Application Spa?
North America is the fastest-growing region in the smart process application market, with its market size anticipated to expand from $5.83 billion in 2023 to $14.48 billion by 2033, driven by technological advancements and business adoption of SPA solutions.
Does ConsaInsights provide customized market report data for the smart Process Application Spa industry?
Yes, Consainsights offers customized market report data tailored specifically to the needs of clients within the smart process application industry, ensuring relevant insights that reflect specific interests and strategic goals.
What deliverables can I expect from this smart Process Application Spa market research project?
Deliverables from a smart process application market research project include comprehensive reports featuring market size, growth forecasts, detailed analysis of key players, segment data, regional insights, and actionable recommendations for strategic planning.
What are the market trends of smart Process Application Spa?
Current market trends in the smart process application industry include a strong shift towards cloud-based deployments, a focus on artificial intelligence integration, and an increasing emphasis on customer experience enhancement, shaping future offerings and competitive strategies.