
Soft Drinks Packaging Market Report
First published: 23 October 2024 | Last updated: 01 February 2026 | Report Code: soft-drinks-packaging
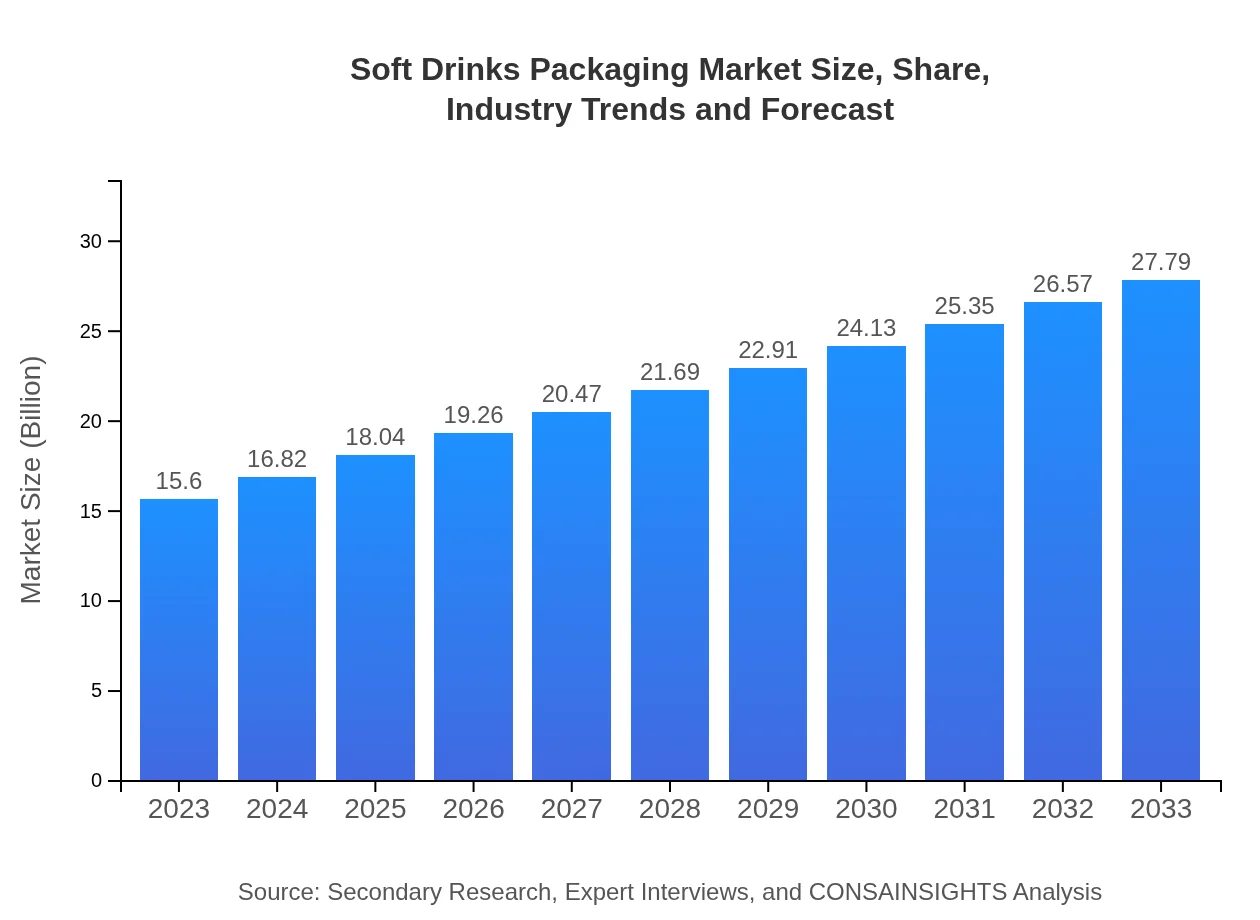
Soft Drinks Packaging Market — USD 15.6 billion in 2023, Growing to USD 27.79B by 2033 at 5.8% CAGR
This report provides a comprehensive overview of the Soft Drinks Packaging market, covering market dynamics, trends, segmentations, and forecasts from 2023 to 2033, equipping stakeholders with valuable insights into industry performance and future expectations.
| Metric | Value |
|---|---|
| Study Period | 2023 - 2033 |
| 2023 Market Size | $15.60 Billion |
| CAGR (2023-2033) | 5.8% |
| 2033 Market Size | $27.79 Billion |
| Top Companies | Crown Holdings, Inc., Tetra Pak, Ball Corporation, Amcor PLC |
| Published Date | 23 October 2024 |
| Last Modified Date | 01 February 2026 |
Soft Drinks Packaging Market Overview
Customize Soft Drinks Packaging Market Report market research report
- ✔ Get in-depth analysis of Soft Drinks Packaging market size, growth, and forecasts.
- ✔ Understand Soft Drinks Packaging's regional dynamics and industry-specific trends.
- ✔ Identify potential applications, end-user demand, and growth segments in Soft Drinks Packaging
What is the Market Size & CAGR of Soft Drinks Packaging market in 2023?
Soft Drinks Packaging Industry Analysis
Soft Drinks Packaging Market Segmentation and Scope
Tell us your focus area and get a customized research report.
Soft Drinks Packaging Market Analysis Report by Region
Europe Soft Drinks Packaging Market Report:
Europe's market for Soft Drinks Packaging is expected to escalate from $3.80 billion in 2023 to $6.77 billion by 2033, supported by stringent recycling regulations and a consumer shift toward eco-friendly packaging practices.Asia Pacific Soft Drinks Packaging Market Report:
In the Asia Pacific region, the Soft Drinks Packaging market was valued at $2.97 billion in 2023 and is expected to reach $5.28 billion by 2033. This growth is attributed to rising urbanization, a growing middle class with increased disposable income, and an expanding beverage market fueled by youthful demographics.North America Soft Drinks Packaging Market Report:
North America leads the Soft Drinks Packaging market, projected to grow from $5.80 billion in 2023 to $10.34 billion in 2033. The presence of major beverage giants and a strong emphasis on sustainable packaging initiatives drive this robust growth.South America Soft Drinks Packaging Market Report:
South America presents a mixed growth outlook for the Soft Drinks Packaging market, with a valuation of $0.92 billion in 2023 anticipated to reach $1.64 billion by 2033. Increasing health awareness and demand for non-carbonated drinks are propelling shifts towards diverse packaging solutions.Middle East & Africa Soft Drinks Packaging Market Report:
The Middle East and Africa region saw a market size of $2.11 billion in 2023, projected to grow to $3.75 billion by 2033. This growth is incited by increasing beverage consumption and market entry of international brands.Tell us your focus area and get a customized research report.
Soft Drinks Packaging Market Analysis By Type
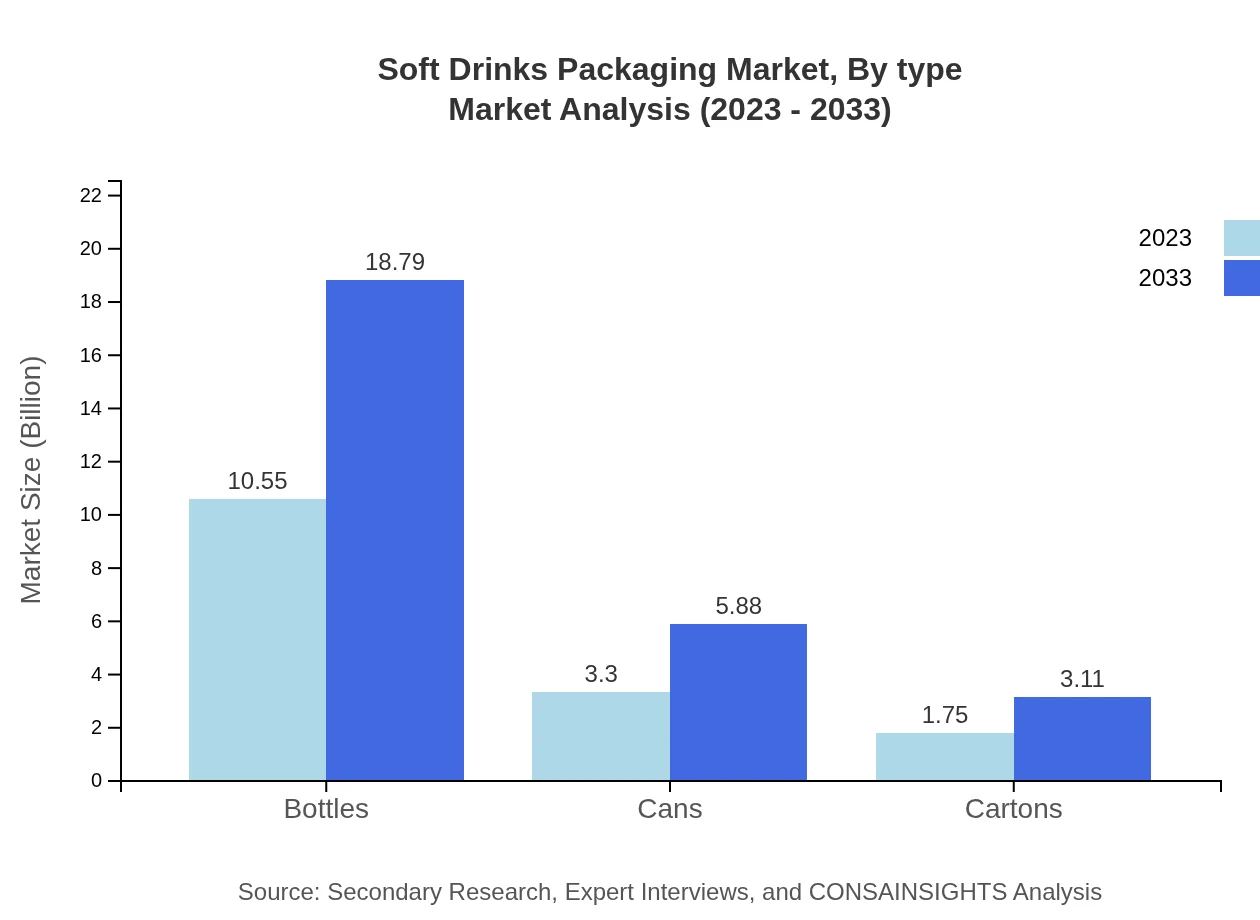
The packaging types in the Soft Drinks Packaging market include: Bottles, with a size of $10.55 billion in 2023 increasing to $18.79 billion by 2033, holding a 67.64% market share. Cans have a size of $3.30 billion in 2023 projected to $5.88 billion by 2033, capturing 21.16% market share. Cartons are expected to grow from $1.75 billion to $3.11 billion, with an 11.2% market share.
Soft Drinks Packaging Market Analysis By Material
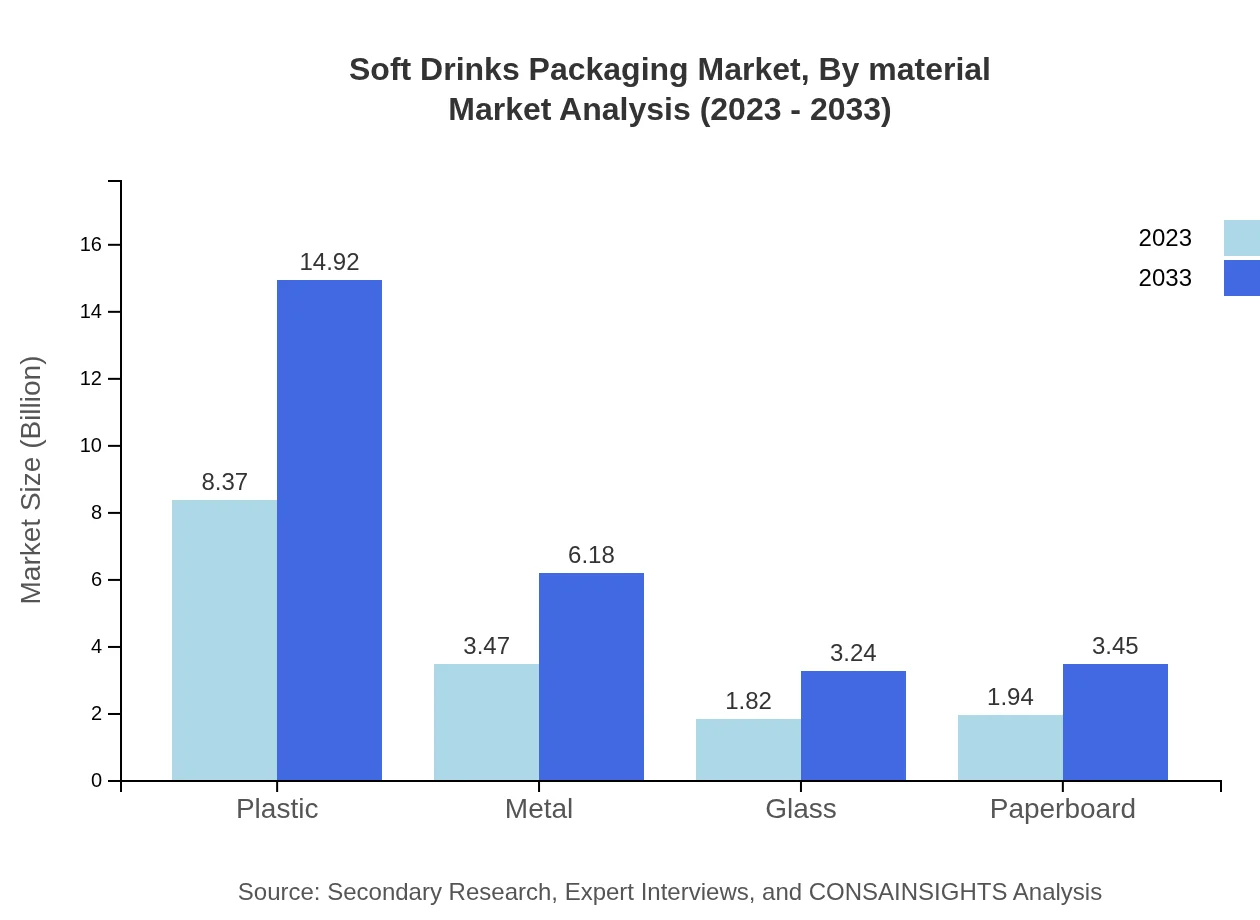
Packaging materials encompass various types: Plastic leads with a size of $8.37 billion in 2023, expected to rise to $14.92 billion by 2033, holding a 53.68% share. Metal accounts for a market size of $3.47 billion in 2023 with a significant market share of 22.24%. Glass and paperboard are smaller players, expected to grow from $1.82 billion to $3.24 billion and from $1.94 billion to $3.45 billion, respectively.
Soft Drinks Packaging Market Analysis By Application
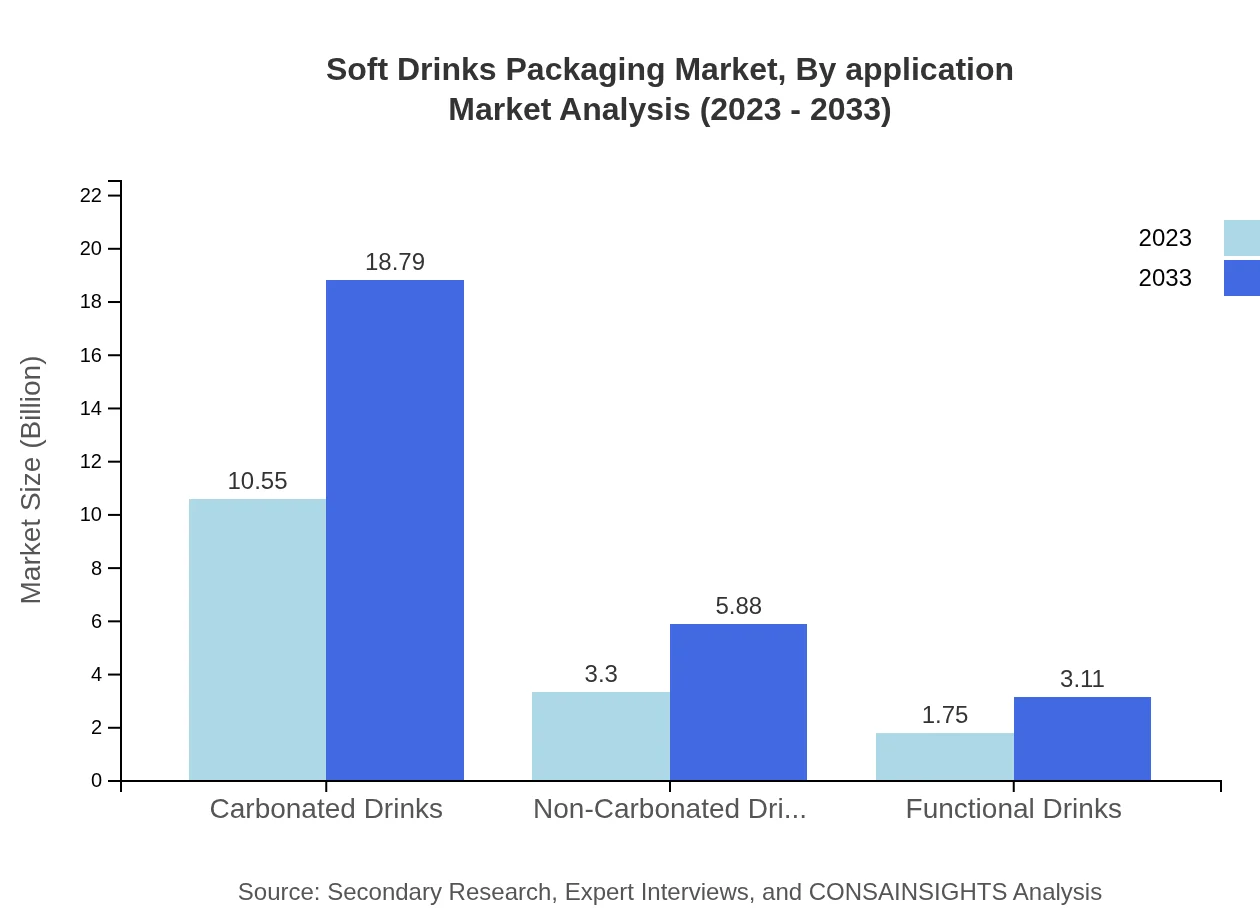
The application segments reveal varied performances: Carbonated Drinks hold a size of $10.55 billion with a share of 67.64%, while Non-Carbonated Drinks are valued at $3.30 billion with 21.16% share. Functional Drinks are anticipated to grow from $1.75 billion in 2023 to $3.11 billion by 2033.
Soft Drinks Packaging Market Analysis By Distribution Channel
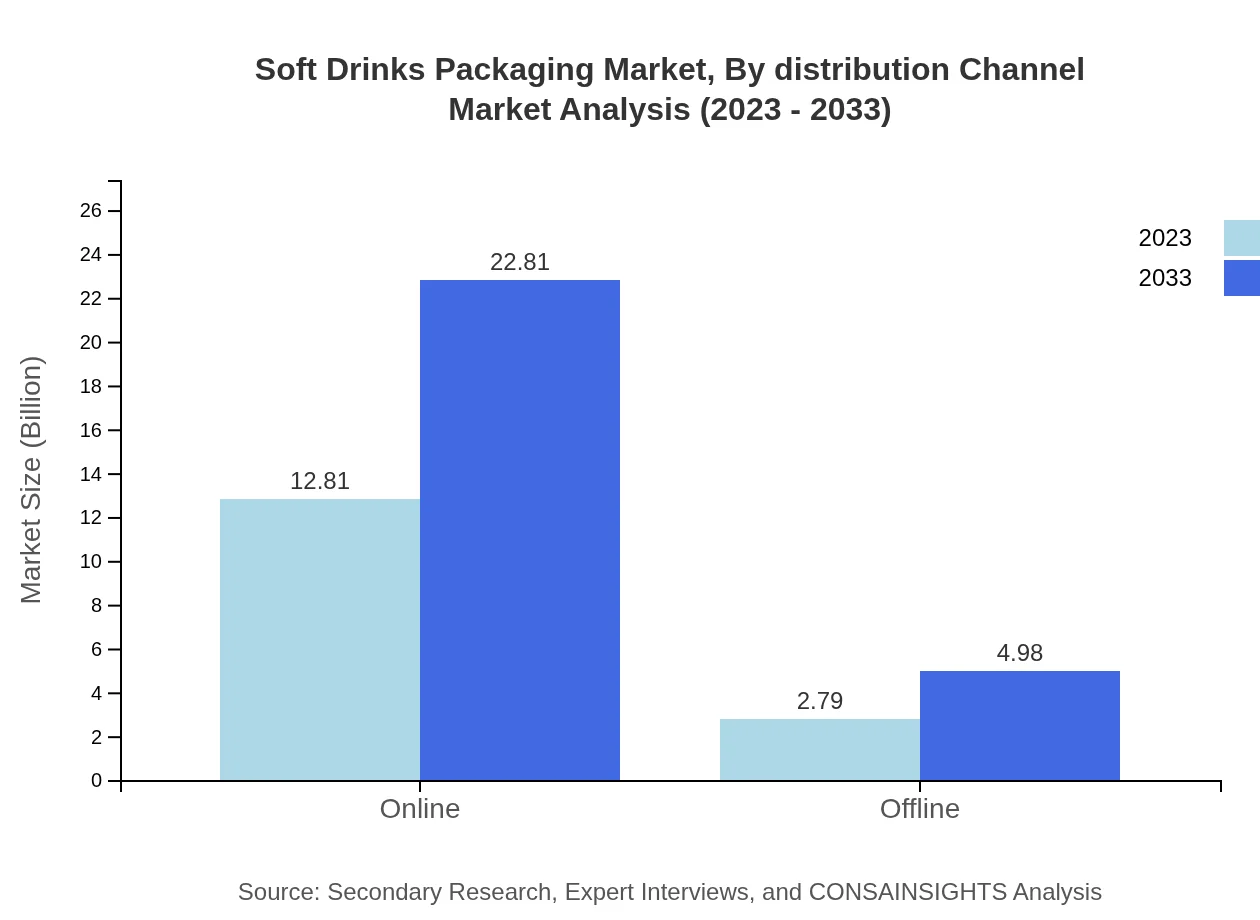
Distribution channels highlight emerging trends: Online sales capture a significant size of $12.81 billion in 2023, expected to reach $22.81 billion by 2033, indicating a growing preference for online grocery shopping. Offline sales currently valued at $2.79 billion are projected to grow to $4.98 billion.
Soft Drinks Packaging Market Analysis By Sustainability
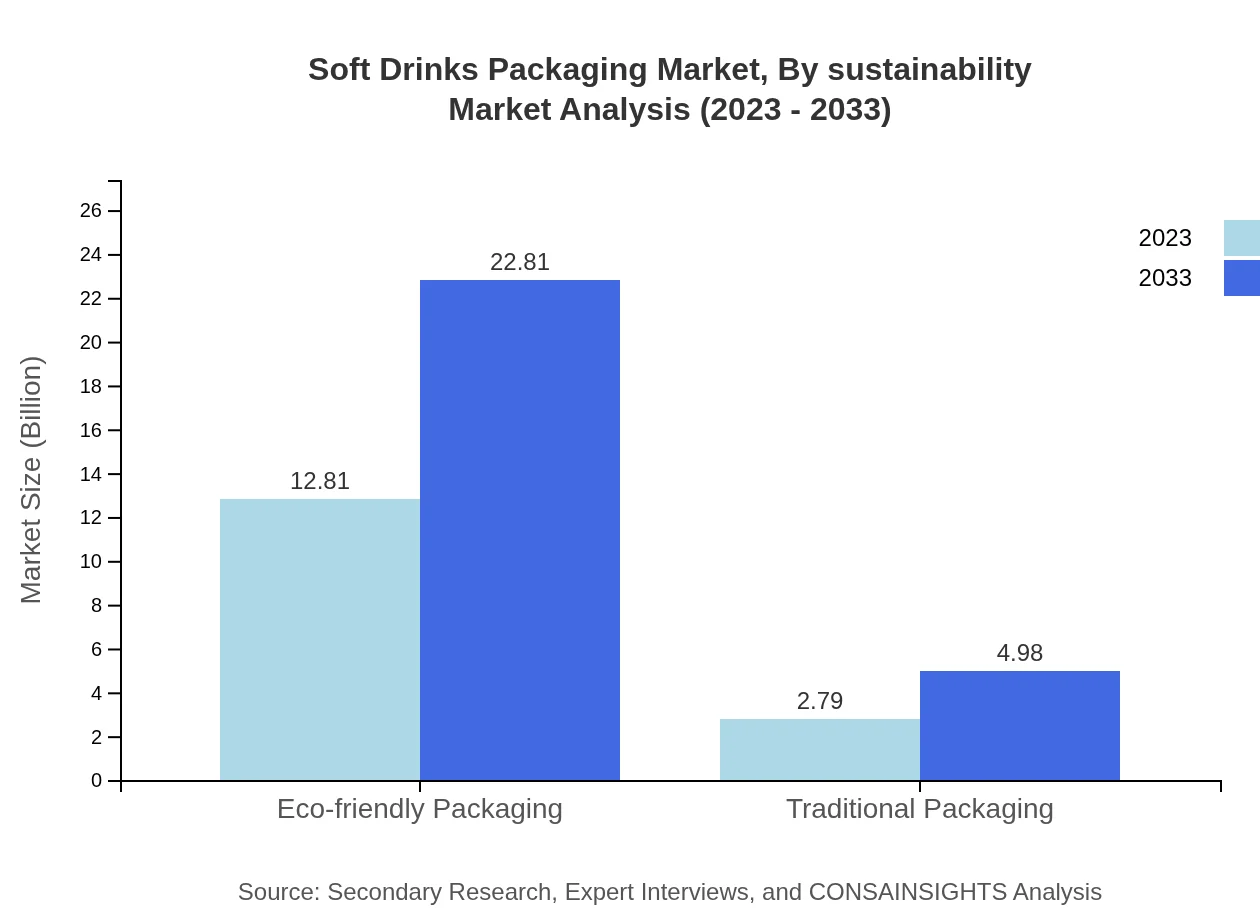
The sustainability segment is becoming increasingly important: Eco-friendly Packaging grew from $12.81 billion in 2023 to $22.81 billion by 2033 with an 82.09% market share, while Traditional Packaging saw a growth from $2.79 billion to $4.98 billion with 17.91% market share.
Soft Drinks Packaging Market Trends and Future Forecast
Tell us your focus area and get a customized research report.
Global Market Leaders and Top Companies in Soft Drinks Packaging Industry
Crown Holdings, Inc.:
Crown Holdings is a leading provider of packaging products, specializing in metal packaging for soft drinks, known for its innovative design and sustainability initiatives.Tetra Pak:
A key player in the beverage packaging industry, Tetra Pak offers a range of packaging solutions that aim to reduce environmental impact while enhancing product shelf life.Ball Corporation:
Ball Corporation is a significant manufacturer of aluminum cans, recognized for its commitment to recycling and sustainable production practices.Amcor PLC:
Amcor is a global leader in packaging solutions, offering a wide array of products tailored to meet the needs of the beverage industry with an emphasis on sustainability.We're grateful to work with incredible clients.


FAQs
What is the market size of soft Drinks Packaging?
The global soft drinks packaging market is valued at approximately $15.6 billion in 2023 and is projected to grow at a CAGR of 5.8%, reaching around $27 billion by 2033. This indicates robust growth and rising demand for innovative packaging solutions.
What are the key market players or companies in the soft Drinks Packaging industry?
Key players in the soft-drinks packaging industry include multinational corporations such as Coca-Cola Consolidated, PepsiCo, Ball Corporation, and Amcor. These companies lead in innovation, sustainability practices, and have a significant market share globally.
What are the primary factors driving the growth in the soft Drinks Packaging industry?
Growth in the soft drinks packaging industry is primarily driven by increasing consumer demand for convenience, innovation in packaging, and a shift towards eco-friendly materials. Additionally, the rising trend of health consciousness is influencing packaging design.
Which region is the fastest Growing in the soft Drinks Packaging market?
The Asia Pacific region is currently the fastest-growing market for soft drinks packaging. Market projections indicate growth from $2.97 billion in 2023 to approximately $5.28 billion by 2033, reflecting increased consumption and urbanization.
Does ConsaInsights provide customized market report data for the soft Drinks Packaging industry?
Yes, ConsaInsights provides tailored market report data for the soft-drinks packaging industry. Custom reports can include specific regional analysis, segment performance, and competitive landscape, ensuring alignment with client needs and strategies.
What deliverables can I expect from this soft Drinks Packaging market research project?
Deliverables from this soft-drinks packaging market research project typically include a comprehensive report, detailed segmentation analysis, regional insights, market forecasts, competitive profiling, and strategic recommendations for stakeholders.
What are the market trends of soft Drinks Packaging?
Current trends in soft drinks packaging include a shift towards sustainable materials, increasing use of smart packaging, and a focus on minimalist designs. Additionally, there is a rise in demand for packaging that enhances product shelf-life and consumer convenience.