Reports >
Technology And Media
>
Visual Analytics Market Report

Visual Analytics Market Report
Published Date: 31 January 2026 | Report Code: visual-analytics
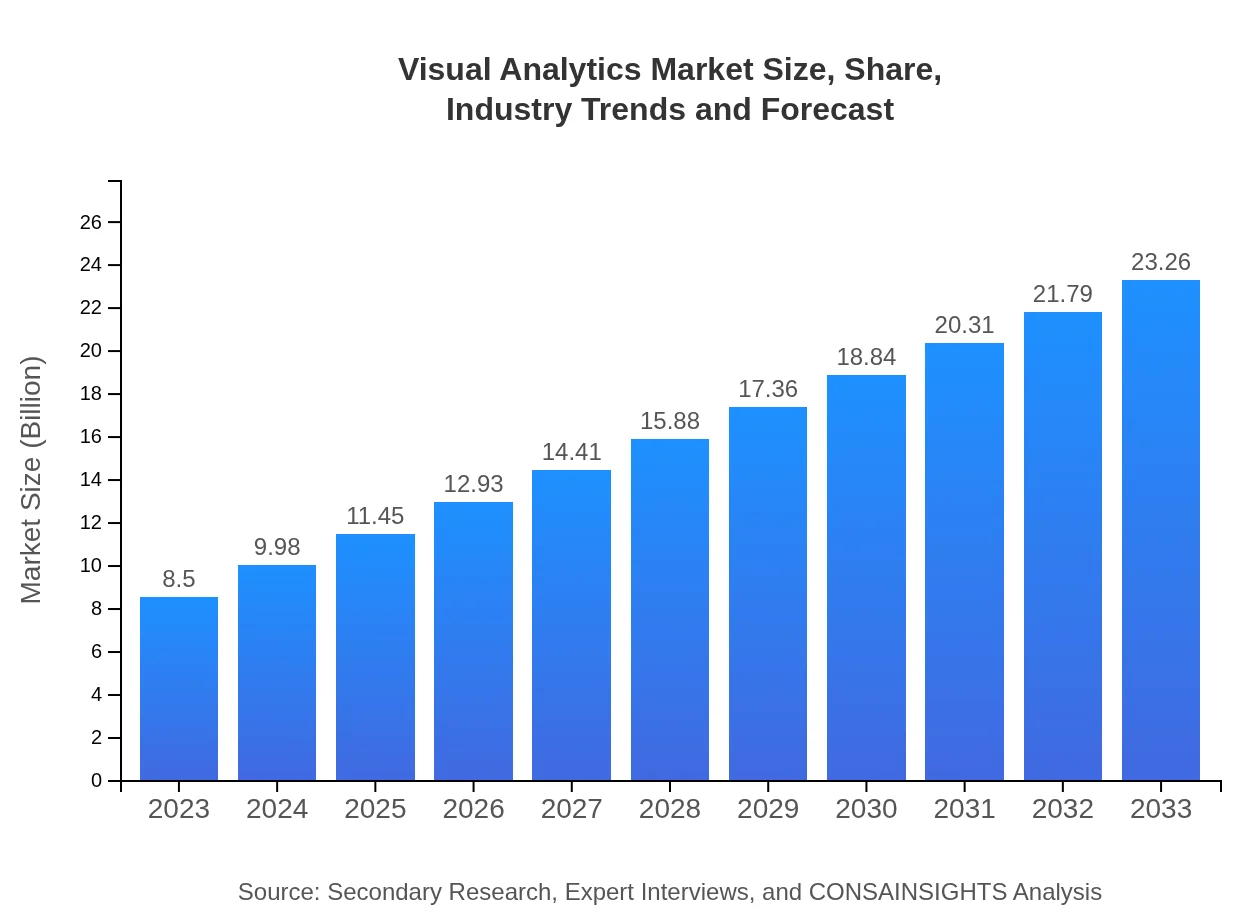
Visual Analytics Market Size, Share, Industry Trends and Forecast to 2033
This report provides a comprehensive analysis of the Visual Analytics market, including current trends, size, and projections from 2023 to 2033. It offers insights on market conditions, regional analysis, technological advancements, and key industry players.
| Metric | Value |
|---|---|
| Study Period | 2023 - 2033 |
| 2023 Market Size | $8.50 Billion |
| CAGR (2023-2033) | 10.2% |
| 2033 Market Size | $23.26 Billion |
| Top Companies | Tableau Software, LLC, Microsoft Power BI, Qlik Technologies, Inc., SAS Institute, Inc., IBM Watson Analytics |
| Last Modified Date | 31 January 2026 |
Visual Analytics Market Overview
Customize Visual Analytics Market Report market research report
- ✔ Get in-depth analysis of Visual Analytics market size, growth, and forecasts.
- ✔ Understand Visual Analytics's regional dynamics and industry-specific trends.
- ✔ Identify potential applications, end-user demand, and growth segments in Visual Analytics
What is the Market Size & CAGR of Visual Analytics market in 2023-2033?
Visual Analytics Industry Analysis
Visual Analytics Market Segmentation and Scope
Tell us your focus area and get a customized research report.
Visual Analytics Market Analysis Report by Region
Europe Visual Analytics Market Report:
The European market is projected to increase from $2.27 billion in 2023 to $6.20 billion by 2033. Factors such as stringent regulations promoting data protection and rising demand for compliance-related analytics are central to this growth.Asia Pacific Visual Analytics Market Report:
In the Asia Pacific region, the Visual Analytics market is expected to grow from $1.66 billion in 2023 to $4.55 billion by 2033, driven by increasing investment in data modernization and a surge in digital transformation initiatives.North America Visual Analytics Market Report:
North America leads the Visual Analytics market, with a size of $3.22 billion in 2023 expected to grow to $8.80 billion by 2033. This growth is supported by the presence of major tech companies, advancements in AI technologies, and an established infrastructure for data analytics.South America Visual Analytics Market Report:
The South American market is estimated to rise from $0.70 billion in 2023 to $1.90 billion by 2033. Growth is primarily fueled by the rising adoption of analytics solutions in key sectors such as retail and finance, amid increasing awareness about data-driven decision-making.Middle East & Africa Visual Analytics Market Report:
The Middle East and Africa are predicted to see growth from $0.66 billion in 2023 to $1.81 billion by 2033, driven by increased investments in smart technologies and a growing focus on enhancing operational efficiencies through data visualization.Tell us your focus area and get a customized research report.
Visual Analytics Market Analysis By Product
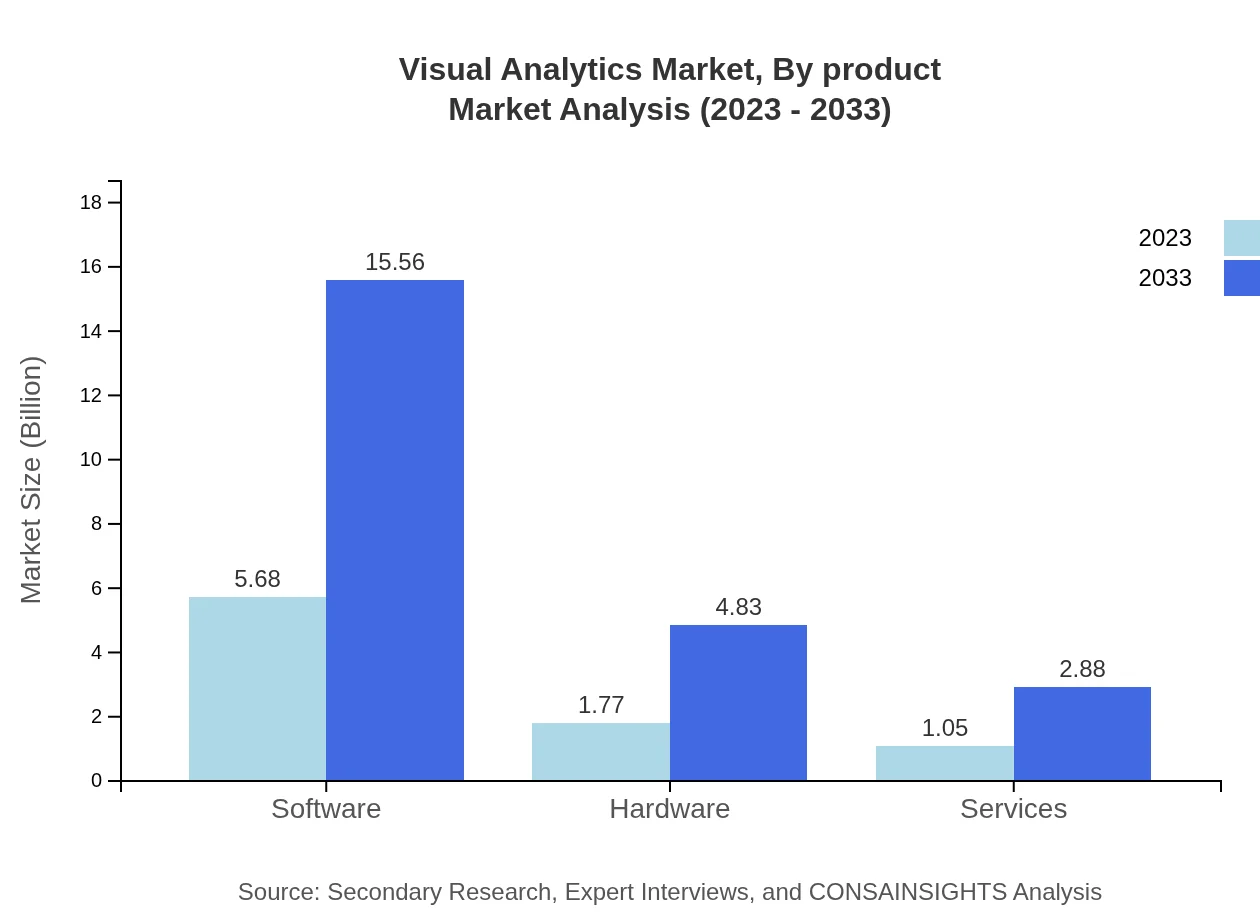
In 2023, software solutions dominate the Visual Analytics market at $5.68 billion, further anticipated to reach $15.56 billion by 2033. The software segment's significant share reflects its essential role in enabling data visualization and business intelligence capabilities, crucial for enhancing organizational insights.
Visual Analytics Market Analysis By Application
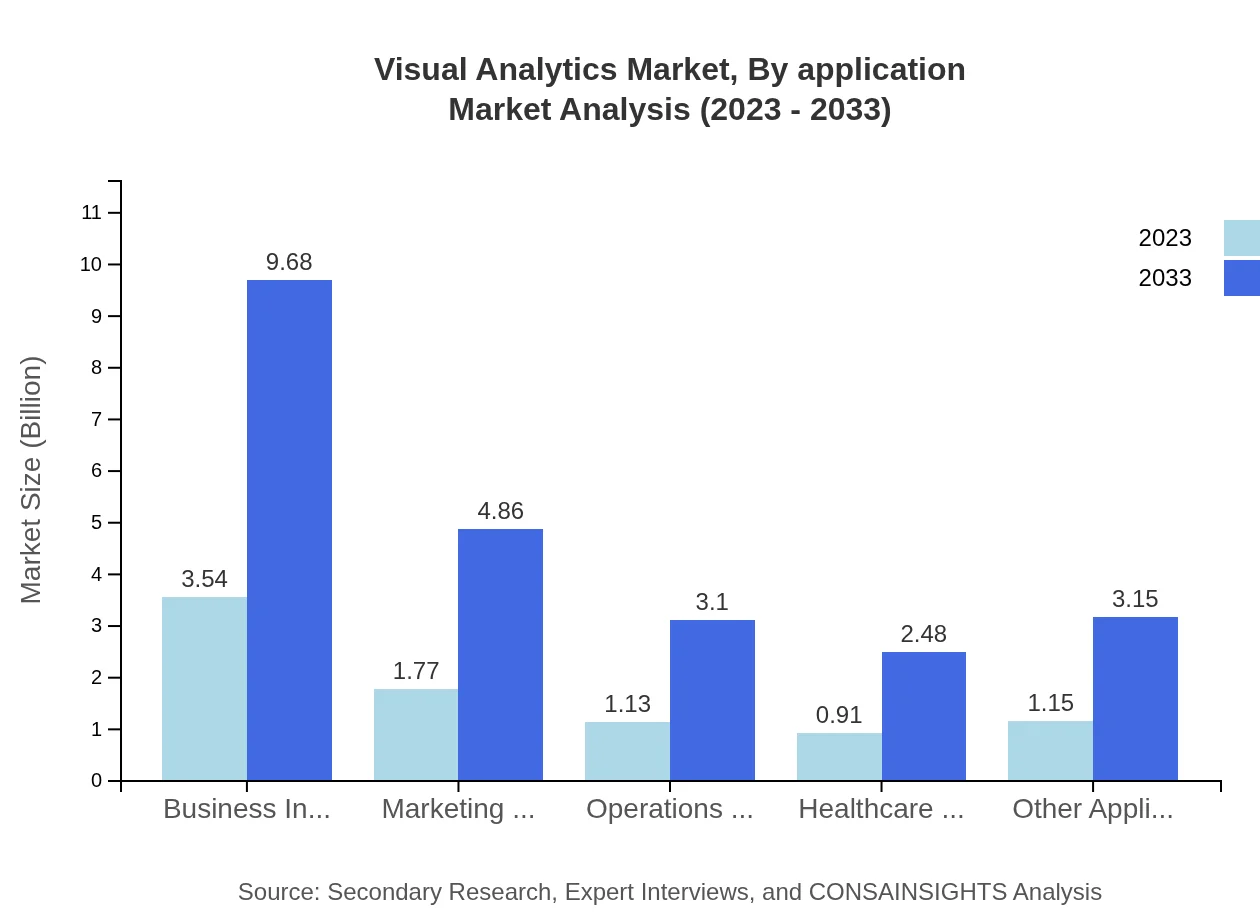
Applications of Visual Analytics are pivotal with notable growth in sectors such as BFSI, IT, and healthcare. For instance, healthcare analytics, valued at $0.91 billion in 2023, is expected to rise to $2.48 billion by 2033, indicating increased investments in data insights for patient care and resource management.
Visual Analytics Market Analysis By Deployment Mode
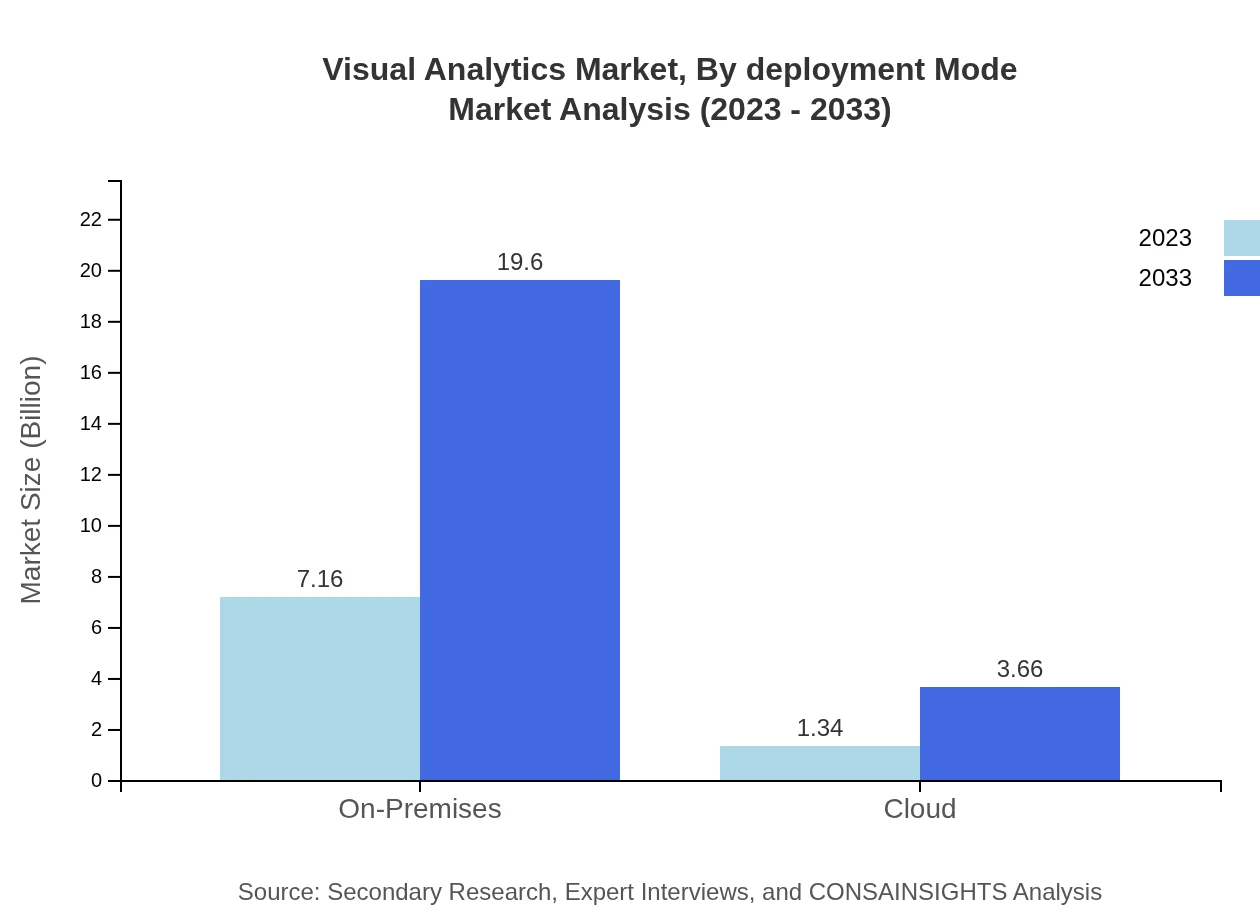
Deployment modes significantly influence market dynamics. In 2023, on-premises solutions account for $7.16 billion, representing 84.25% of the market. However, cloud deployment is becoming increasingly popular, expected to grow from $1.34 billion to $3.66 billion by 2033, illustrating a shift towards more flexible and scalable solutions.
Visual Analytics Market Analysis By End User
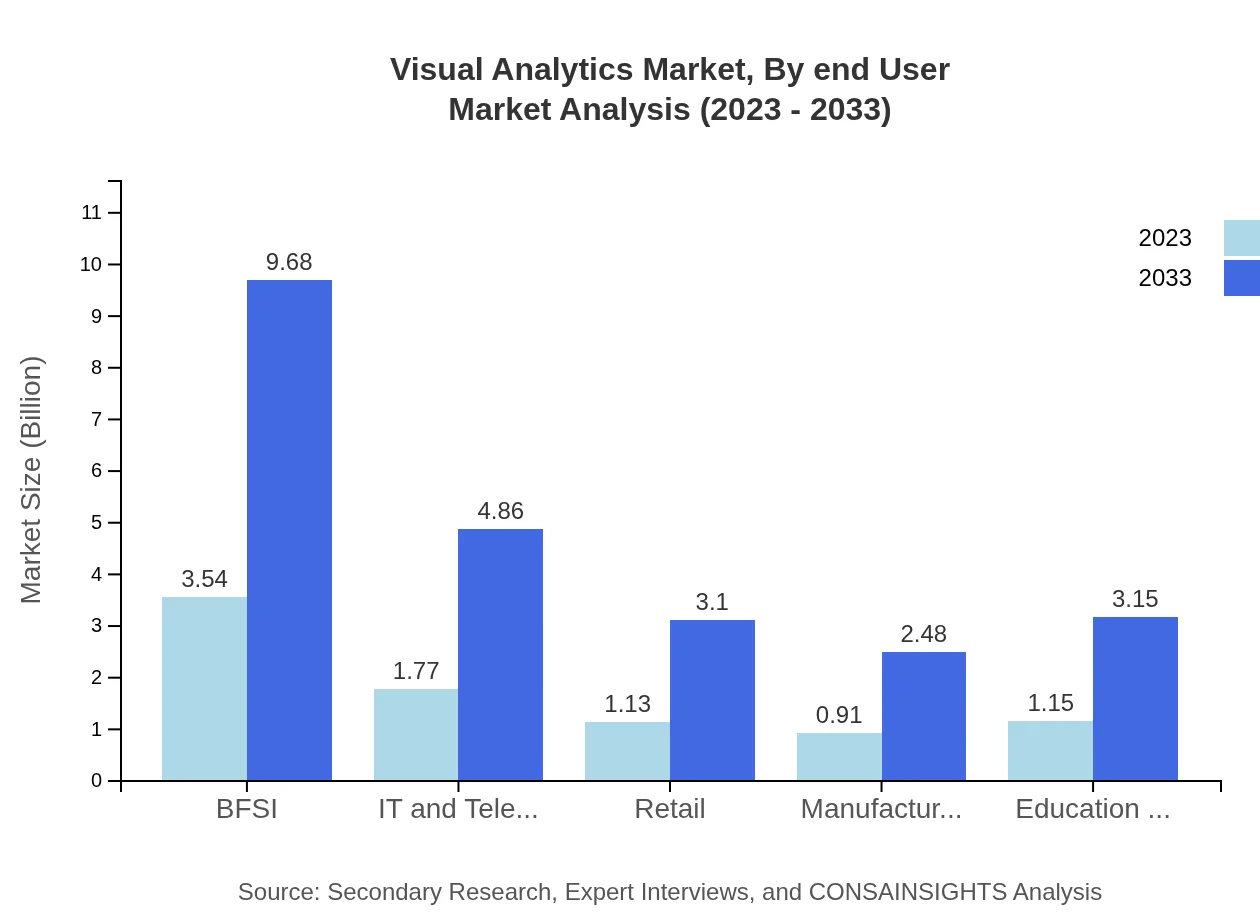
End-user analysis reveals BFSI as a primary sector, holding a market share of 41.59% in 2023, projected to grow from $3.54 billion to $9.68 billion by 2033. Retail, education, and healthcare are also substantial contributors as organizations recognize the value of data-driven insights.
Visual Analytics Market Analysis By Technology
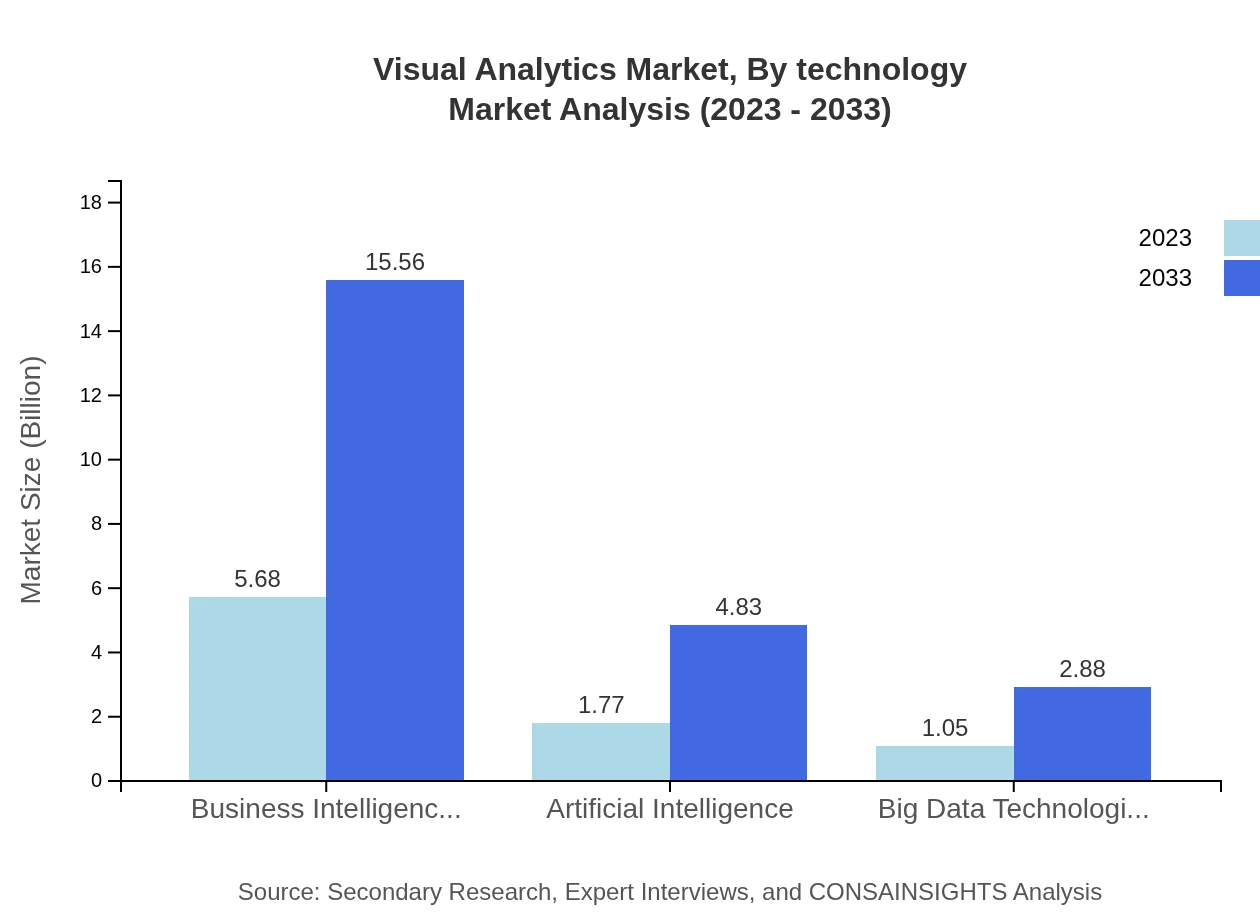
Technological advancements are crucial to market growth. Business Intelligence tools lead at $5.68 billion in 2023. Innovations in AI and machine learning greatly enhance analytics capabilities, providing real-time insights and predictive analytics, which are invaluable for strategic decision-making.
Visual Analytics Market Trends and Future Forecast
Tell us your focus area and get a customized research report.
Global Market Leaders and Top Companies in Visual Analytics Industry
Tableau Software, LLC:
A leading provider of visual analytics solutions, Tableau helps organizations visualize their data and share insights across teams. Its user-friendly interface and powerful analytics capabilities have made it a favorite among businesses.Microsoft Power BI:
Microsoft's Power BI is known for its comprehensive analytics and data visualization tools, facilitating business intelligence through an integrated suite of applications that empowers users to create impactful reports.Qlik Technologies, Inc.:
Qlik is renowned for its associative data model enabling in-depth data exploration and discovery. Its powerful analytics and reporting tools make it integral to organizations aiming to leverage data for strategic advantages.SAS Institute, Inc.:
SAS provides a robust platform for visual analytics, catering mainly to data-driven organizations seeking to harness advanced analytics and machine learning for thorough data insights.IBM Watson Analytics:
IBM Watson combines AI with data analysis to deliver innovative visual analytics solutions, which are pivotal in enhancing organizational decision-making through predictive insights.We're grateful to work with incredible clients.


FAQs
What is the market size of visual Analytics?
The visual analytics market is valued at approximately $8.5 billion in 2023 and is projected to grow with a CAGR of 10.2% through 2033, reflecting increasing investments in data analysis and visualization techniques across industries.
What are the key market players or companies in this visual Analytics industry?
Key players in the visual analytics market include major companies like Tableau, Microsoft Power BI, Qlik, SAP, and Oracle. These firms are leaders in innovative data visualization solutions, leveraging advanced analytics to provide insights across various sectors.
What are the primary factors driving the growth in the visual Analytics industry?
The growth in the visual analytics industry is driven by increasing data volumes, the rise of big data technologies, the need for real-time insights, and advancements in AI and machine learning which enhance user experience and analytical capabilities.
Which region is the fastest Growing in the visual Analytics?
The fastest-growing region in the visual analytics market is Europe, projected to grow from $2.27 billion in 2023 to $6.20 billion by 2033. Other strong contenders include Asia Pacific and North America, each with significant growth forecasts.
Does ConsaInsights provide customized market report data for the visual Analytics industry?
Yes, Consainsights offers customized market report data tailored to specific needs within the visual analytics industry. This includes detailed insights on market dynamics, competitive analysis, and segmentation according to client specifications.
What deliverables can I expect from this visual Analytics market research project?
Deliverables from the visual analytics market research project include comprehensive reports featuring market size, growth forecasts, trend analysis, competitive landscape, and segmented data for regions and application areas crucial for strategic planning.
What are the market trends of visual analytics?
Current trends in visual analytics include increased adoption of AI-driven tools, integration of cloud-based solutions, and a growing focus on user-friendly interfaces. Enhanced demand for mobile analytics and real-time data visualization is also notable.